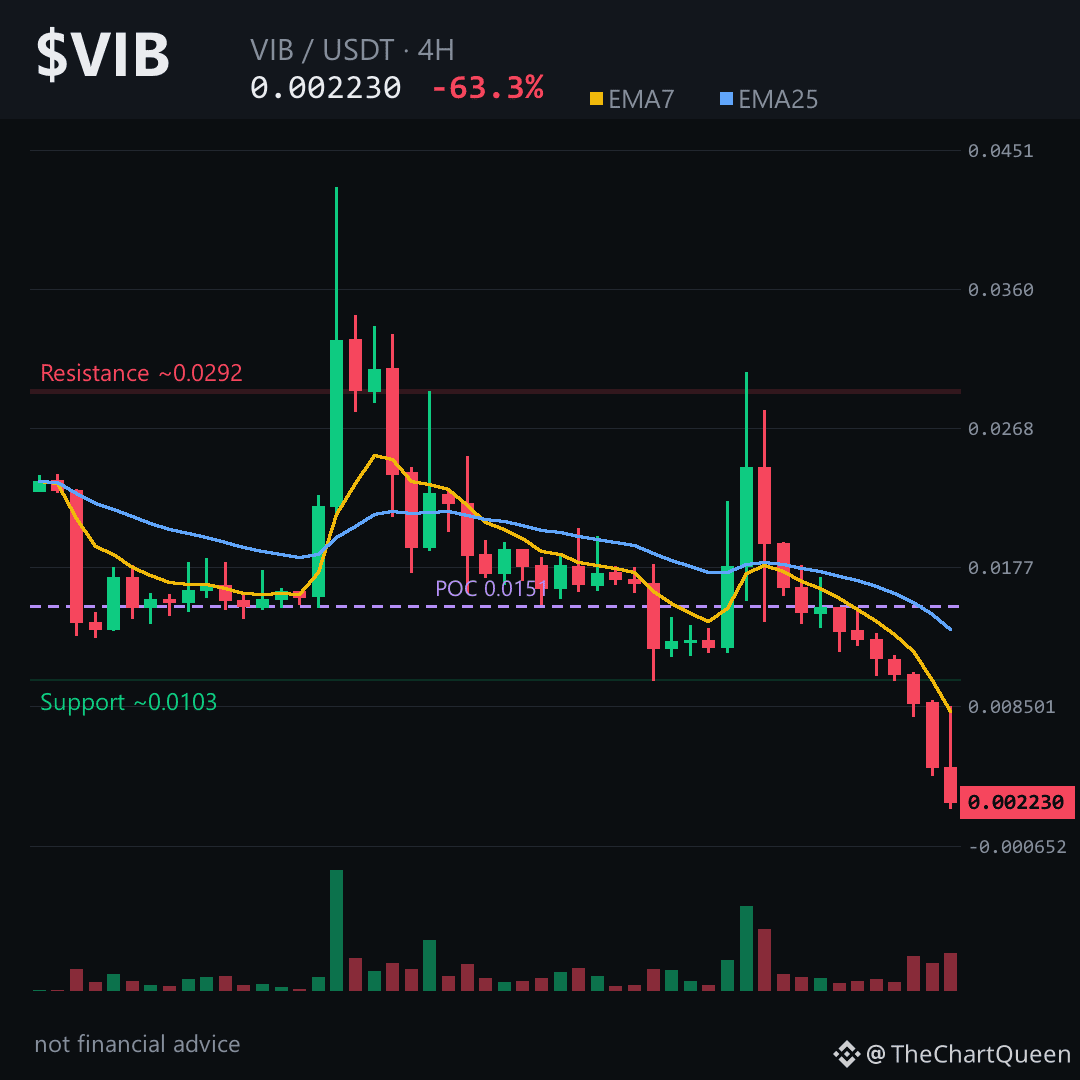
A 63% wipe in 24 hours isn’t a dip. It’s a liquidation event wearing a ticker.
That vertical candle looks like a full-blown rug — but the structure is telling a different story.
The 4H shows a brutal cascade: 0.024 to 0.0044, then one final flush to 0.0018 before a weak bounce. Eleven of twelve candles red. That’s not selling pressure — that’s forced exits and panic. But here’s the trap: after a -63% day, everyone expects a bounce. The chart says not yet.
RSI on 4H and daily is pinned in the low 20s–30s — deeply oversold, but oversold doesn’t mean over. EMAs are stacked bearish across every timeframe. The 4H EMA7 sits near 0.0082, miles above price. That’s not a gap — it’s a canyon.
Key zone: the unfilled bearish FVG between roughly 0.0089 and 0.0102. Price fell through it like nothing, and now it acts as a magnet. But before any retest, $VIB needs to reclaim 0.00235 on a 4H close. Lose that and the objective drops toward 0.0020 — already tested once at the lows.
My read: a falling knife with no confirmed floor. Any bounce toward 0.0023–0.0024 is likely to be sold until longer-term EMAs catch down. The real risk isn’t missing the bottom — it’s catching a bear flag that never flags.
Tap $VIB to pull up the chart and check these zones yourself before you make any move.
What level are you watching first — the 0.0020 retest or a reclaim of 0.00235? Drop it below 👇
Follow for the next read on this chart.
⚠️ Not financial advice. DYOR.
#VIB #Crypto #TopLoser #BinanceSquare
That vertical candle looks like a full-blown rug — but the structure is telling a different story.
The 4H shows a brutal cascade: 0.024 to 0.0044, then one final flush to 0.0018 before a weak bounce. Eleven of twelve candles red. That’s not selling pressure — that’s forced exits and panic. But here’s the trap: after a -63% day, everyone expects a bounce. The chart says not yet.
RSI on 4H and daily is pinned in the low 20s–30s — deeply oversold, but oversold doesn’t mean over. EMAs are stacked bearish across every timeframe. The 4H EMA7 sits near 0.0082, miles above price. That’s not a gap — it’s a canyon.
Key zone: the unfilled bearish FVG between roughly 0.0089 and 0.0102. Price fell through it like nothing, and now it acts as a magnet. But before any retest, $VIB needs to reclaim 0.00235 on a 4H close. Lose that and the objective drops toward 0.0020 — already tested once at the lows.
My read: a falling knife with no confirmed floor. Any bounce toward 0.0023–0.0024 is likely to be sold until longer-term EMAs catch down. The real risk isn’t missing the bottom — it’s catching a bear flag that never flags.
Tap $VIB to pull up the chart and check these zones yourself before you make any move.
What level are you watching first — the 0.0020 retest or a reclaim of 0.00235? Drop it below 👇
Follow for the next read on this chart.
⚠️ Not financial advice. DYOR.
#VIB #Crypto #TopLoser #BinanceSquare