A 30% candle and deeply negative funding — that’s a powder keg, not a party.
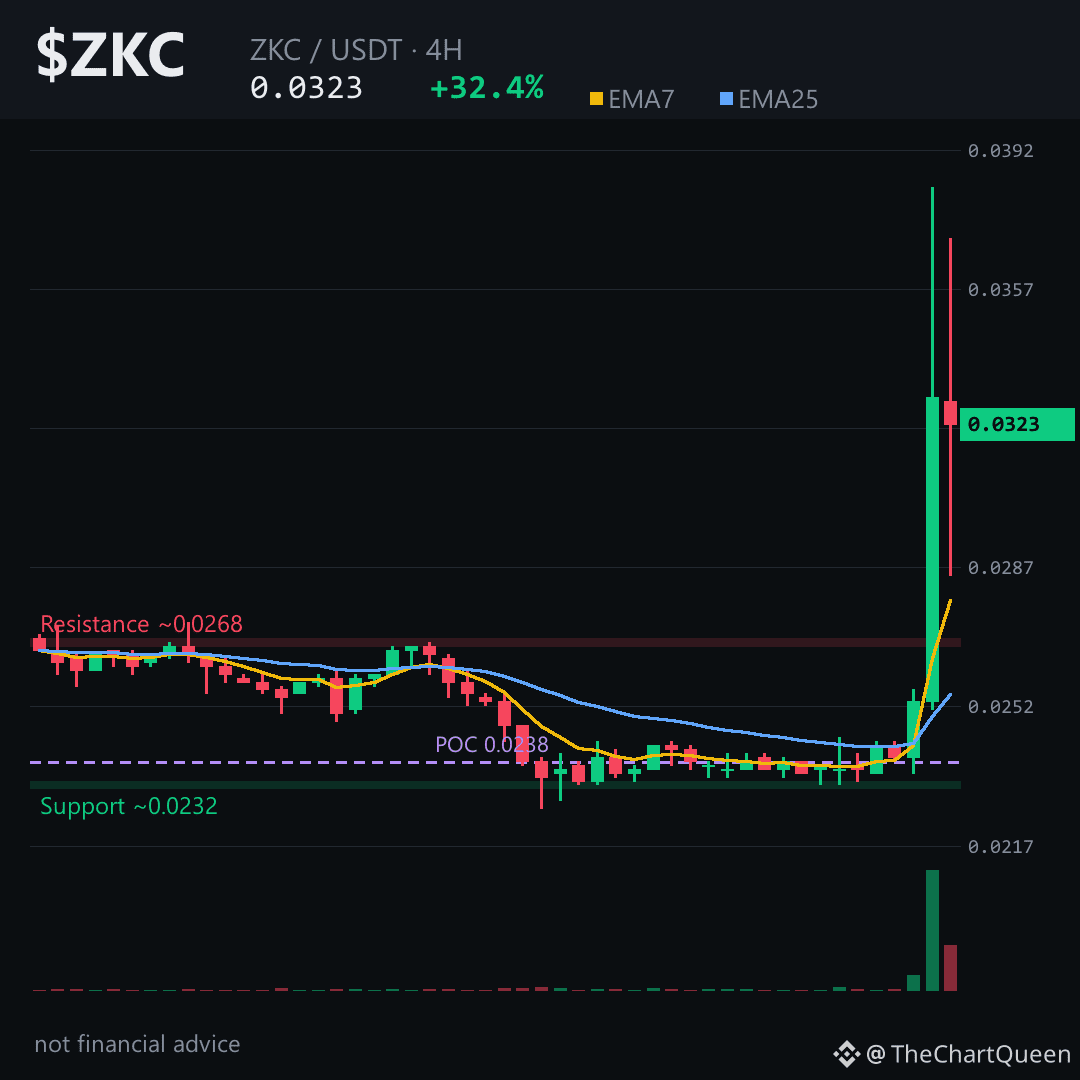
$ZKC just ripped from the low 0.023s to tag 0.0383 before cooling near 0.0323. The 4H chart is screaming momentum: price is riding way above its short-term moving averages, and RSI is pinned in overbought territory above 80. That’s the kind of heat that usually needs a breather.
But here’s the twist 👇
Futures metrics show funding deeply negative while the crowd is heavily net long. That’s an unusual combo — it suggests late shorts are paying through the nose to stay short a coin that refuses to drop. If price holds, that pressure can unwind fast.
The 4H setup is the cleanest read. The bullish structure leans on the ~0.0305 area — lose that on a 4H close and the momentum thesis is off. Above it, the path of least resistance points toward the ~0.035 zone, right where the last swing high stalled.
My read: the chart wants higher, but chasing a 30% candle after an overbought RSI is where accounts get chopped. The real edge is watching how $ZKC behaves around the 0.0305–0.0323 pocket.
That’s the line in the sand. Tap $ZKC to pull up the chart and see it yourself.
Follow me for the update when this level gets retested — not just the pretty green bars.
Which zone are you watching on ZKC 👇
⚠️ Not financial advice. DYOR.
#ZKC #Crypto #BinanceSquare
$ZKC just ripped from the low 0.023s to tag 0.0383 before cooling near 0.0323. The 4H chart is screaming momentum: price is riding way above its short-term moving averages, and RSI is pinned in overbought territory above 80. That’s the kind of heat that usually needs a breather.
But here’s the twist 👇
Futures metrics show funding deeply negative while the crowd is heavily net long. That’s an unusual combo — it suggests late shorts are paying through the nose to stay short a coin that refuses to drop. If price holds, that pressure can unwind fast.
The 4H setup is the cleanest read. The bullish structure leans on the ~0.0305 area — lose that on a 4H close and the momentum thesis is off. Above it, the path of least resistance points toward the ~0.035 zone, right where the last swing high stalled.
My read: the chart wants higher, but chasing a 30% candle after an overbought RSI is where accounts get chopped. The real edge is watching how $ZKC behaves around the 0.0305–0.0323 pocket.
That’s the line in the sand. Tap $ZKC to pull up the chart and see it yourself.
Follow me for the update when this level gets retested — not just the pretty green bars.
Which zone are you watching on ZKC 👇
⚠️ Not financial advice. DYOR.
#ZKC #Crypto #BinanceSquare