Picture a coin that doubled in a day, then paused right at a wall everyone can see.
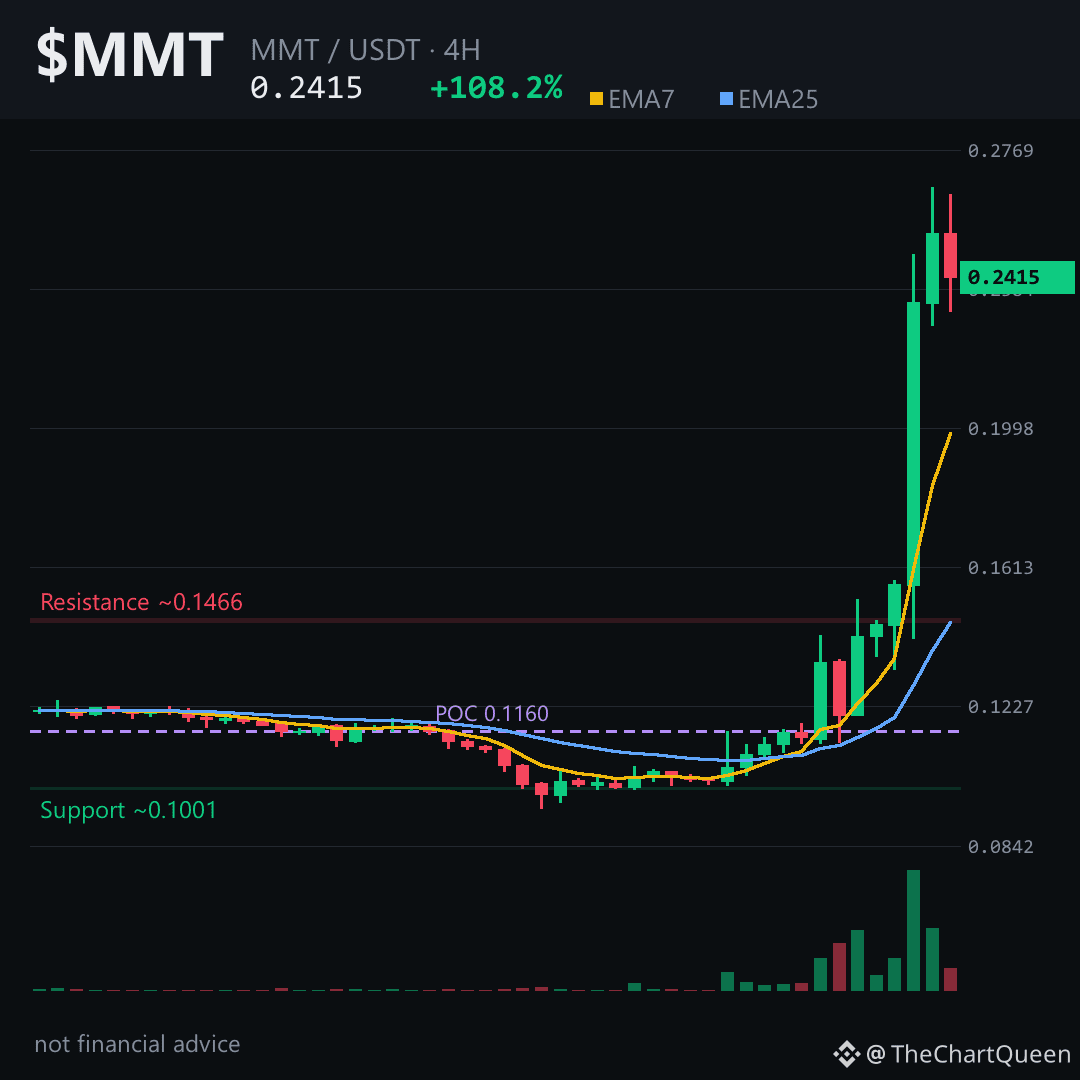
That's $MMT right now — up over 108% in 24 hours, and the 4H chart just printed its first red candle after a monster 50% single candle push.
Funding is barely positive, and the long/short ratio sits below 1. The crowd is leaning short while price rips higher. When shorts pay almost nothing to stay in and price keeps climbing, fuel for continuation often comes from those underwater positions closing out — not fresh buyers.
The 4H picture is the cleanest read. Price is hovering around 0.24, and just below sits a bullish imbalance zone from roughly 0.157 up to 0.228 — an unfilled gap from that explosive move. That zone is the line in the sand. A 4H close back below 0.228 tells me momentum is stalling.
If $MMT holds above that pocket, the measured objective sits near 0.26 — right where the 24H high already tapped and rejected. A reclaim there opens the door to the macro objective around 0.30.
Strong trend with a fragile floor. The risk isn't the upside — it's mistaking a normal pullback for a breakdown. Tap $MMT on the chart and you'll see the gap I'm talking about, sitting right under current price.
I'll be watching whether that 0.228 zone holds on the next 4H close — follow along and I'll share what the chart says next.
What level are you watching most closely on MMT right now? 👇
⚠️ Not financial advice. DYOR.
#MMT #Crypto #Altcoins #BinanceSquare
That's $MMT right now — up over 108% in 24 hours, and the 4H chart just printed its first red candle after a monster 50% single candle push.
Funding is barely positive, and the long/short ratio sits below 1. The crowd is leaning short while price rips higher. When shorts pay almost nothing to stay in and price keeps climbing, fuel for continuation often comes from those underwater positions closing out — not fresh buyers.
The 4H picture is the cleanest read. Price is hovering around 0.24, and just below sits a bullish imbalance zone from roughly 0.157 up to 0.228 — an unfilled gap from that explosive move. That zone is the line in the sand. A 4H close back below 0.228 tells me momentum is stalling.
If $MMT holds above that pocket, the measured objective sits near 0.26 — right where the 24H high already tapped and rejected. A reclaim there opens the door to the macro objective around 0.30.
Strong trend with a fragile floor. The risk isn't the upside — it's mistaking a normal pullback for a breakdown. Tap $MMT on the chart and you'll see the gap I'm talking about, sitting right under current price.
I'll be watching whether that 0.228 zone holds on the next 4H close — follow along and I'll share what the chart says next.
What level are you watching most closely on MMT right now? 👇
⚠️ Not financial advice. DYOR.
#MMT #Crypto #Altcoins #BinanceSquare