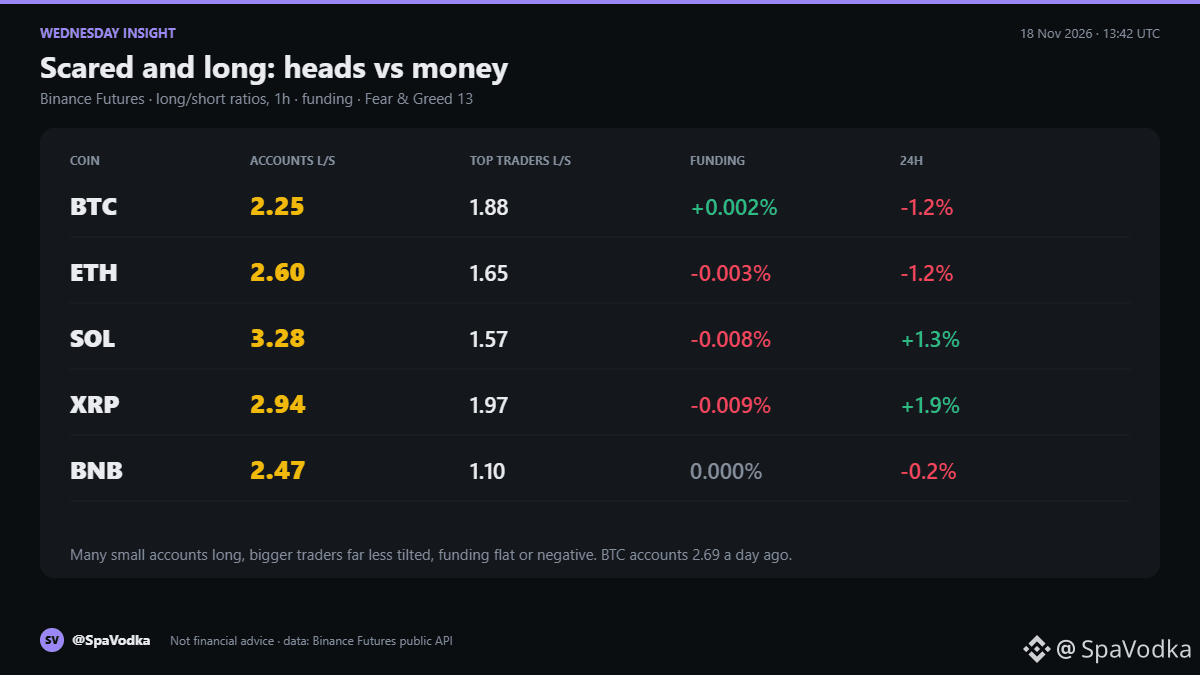
$BTC 64,089 and Fear & Greed reads 13, yet on Binance futures there are still 2.25 accounts long for every short. The crowd is scared and long at the same time.
What I see (Binance Futures data, 18.11, about 14:45 CET):
BTC: 2.25 long accounts per short, down from 2.69 a day ago. Top traders by position: 1.88. Funding 0.002%.
ETH: 2.60 accounts, top traders 1.65, funding minus 0.003%.
SOL: 3.28 accounts, top traders 1.57, funding minus 0.008%.
XRP: 2.94 accounts, top traders 1.97, funding minus 0.009%.
BNB: 2.47 accounts, top traders 1.10, funding flat.
Takers sold slightly more than they bought on BTC and ETH over 24h (0.96 and 0.95).
What I think: the account ratio counts heads, not money. Every major shows the same gap: lots of small accounts long, while the larger traders are far less tilted, and funding is flat or negative. If the long side were heavy in money, longs would be paying. They are not. So this looks like many small longs waiting for a bounce after a hot inflation print lifted the odds of another Fed hike, not a crowded leveraged trade.
That matters for liquidation maps. This morning's CoinGlass 1 day map for BTC had about 31M of longs near 63,100 against three short bars of roughly 22.5M at 65,300 to 65,750. Small longs with stops sit exactly in that kind of pool.
What changes my mind:
1. BTC loses 63,100 on an hourly close: the long pool gets flushed and the account ratio should finally drop below 2.
2. BTC closes an hour above 65,750: shorts are the fuel instead, and the headcount was right.
3. Funding turns clearly positive while accounts stay above 2.5: then the money joins the crowd, and that is the setup I would respect more.
My own scorecard on JTO touch calls is level with a plain volatility baseline (Brier 0.215 vs 0.215, n=108), so treat these as odds, not certainties.
Not financial advice.
Below 2 accounts or above 65,750 first?
#BTC #Liquidations #CryptoMarket
What I see (Binance Futures data, 18.11, about 14:45 CET):
BTC: 2.25 long accounts per short, down from 2.69 a day ago. Top traders by position: 1.88. Funding 0.002%.
ETH: 2.60 accounts, top traders 1.65, funding minus 0.003%.
SOL: 3.28 accounts, top traders 1.57, funding minus 0.008%.
XRP: 2.94 accounts, top traders 1.97, funding minus 0.009%.
BNB: 2.47 accounts, top traders 1.10, funding flat.
Takers sold slightly more than they bought on BTC and ETH over 24h (0.96 and 0.95).
What I think: the account ratio counts heads, not money. Every major shows the same gap: lots of small accounts long, while the larger traders are far less tilted, and funding is flat or negative. If the long side were heavy in money, longs would be paying. They are not. So this looks like many small longs waiting for a bounce after a hot inflation print lifted the odds of another Fed hike, not a crowded leveraged trade.
That matters for liquidation maps. This morning's CoinGlass 1 day map for BTC had about 31M of longs near 63,100 against three short bars of roughly 22.5M at 65,300 to 65,750. Small longs with stops sit exactly in that kind of pool.
What changes my mind:
1. BTC loses 63,100 on an hourly close: the long pool gets flushed and the account ratio should finally drop below 2.
2. BTC closes an hour above 65,750: shorts are the fuel instead, and the headcount was right.
3. Funding turns clearly positive while accounts stay above 2.5: then the money joins the crowd, and that is the setup I would respect more.
My own scorecard on JTO touch calls is level with a plain volatility baseline (Brier 0.215 vs 0.215, n=108), so treat these as odds, not certainties.
Not financial advice.
Below 2 accounts or above 65,750 first?
#BTC #Liquidations #CryptoMarket