MMT Surges 109% in 24 Hours: What the Chart Is Telling Us
Momentum (MMT) has been one of the standout movers on Binance today, and the 1-hour chart shows why traders are paying attention.
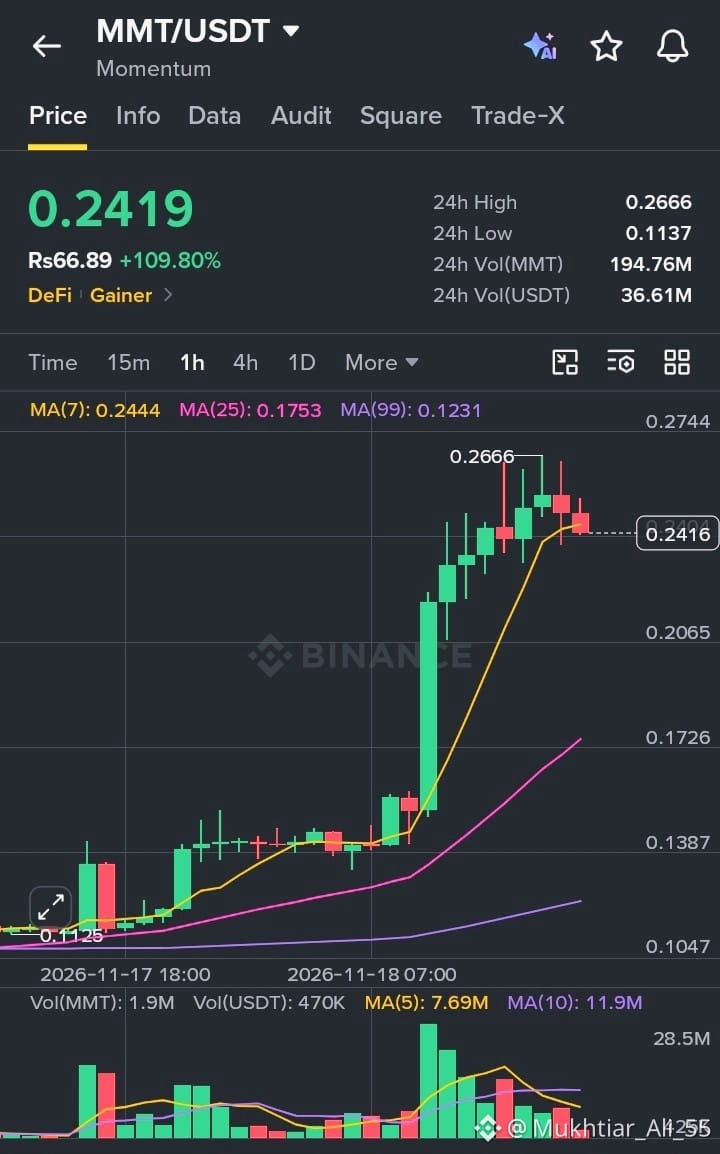
MMT/USDT is trading at 0.2419, up 109.80% in the last 24 hours. It hit a high of 0.2666 after bottoming out around 0.1137, so the price has more than doubled in a single day. Trading activity backs up the move: 24h volume is 194.76M MMT, or roughly 36.61M USDT.
What stands out on the chart:
A strong breakout. After hours of sideways action in the 0.12 to 0.14 range, MMT broke out sharply on 18 November with a series of large green candles and heavy volume.
Moving averages are well separated. The MA(7) at 0.2444 sits far above the MA(25) at 0.1753 and the MA(99) at 0.1231, which shows how steep the move has been.
Early signs of cooling. The last few candles are red, price has slipped below the 0.2666 peak, and it is now testing the MA(7) as support. Volume has also come down from its peak.
My take: Moves like this are exciting, but they rarely go in a straight line. A hold above the MA(7) could mean continuation, while a break below it may lead to a pullback toward the 0.20 to 0.17 zone. Chasing a 100% pump is risky, so it is better to wait for confirmation, size positions carefully, and always use a stop-loss.
#MMT #Momentum #Binance #CryptoTrading #DeFi
$MMT
Momentum (MMT) has been one of the standout movers on Binance today, and the 1-hour chart shows why traders are paying attention.
MMT/USDT is trading at 0.2419, up 109.80% in the last 24 hours. It hit a high of 0.2666 after bottoming out around 0.1137, so the price has more than doubled in a single day. Trading activity backs up the move: 24h volume is 194.76M MMT, or roughly 36.61M USDT.
What stands out on the chart:
A strong breakout. After hours of sideways action in the 0.12 to 0.14 range, MMT broke out sharply on 18 November with a series of large green candles and heavy volume.
Moving averages are well separated. The MA(7) at 0.2444 sits far above the MA(25) at 0.1753 and the MA(99) at 0.1231, which shows how steep the move has been.
Early signs of cooling. The last few candles are red, price has slipped below the 0.2666 peak, and it is now testing the MA(7) as support. Volume has also come down from its peak.
My take: Moves like this are exciting, but they rarely go in a straight line. A hold above the MA(7) could mean continuation, while a break below it may lead to a pullback toward the 0.20 to 0.17 zone. Chasing a 100% pump is risky, so it is better to wait for confirmation, size positions carefully, and always use a stop-loss.
#MMT #Momentum #Binance #CryptoTrading #DeFi
$MMT