🚨 PIEVERSE ($PIEVERSE ) IS MAKING A NEW ATH — BUT HOW MUCH HIGHER CAN IT GO BEFORE A CORRECTION?
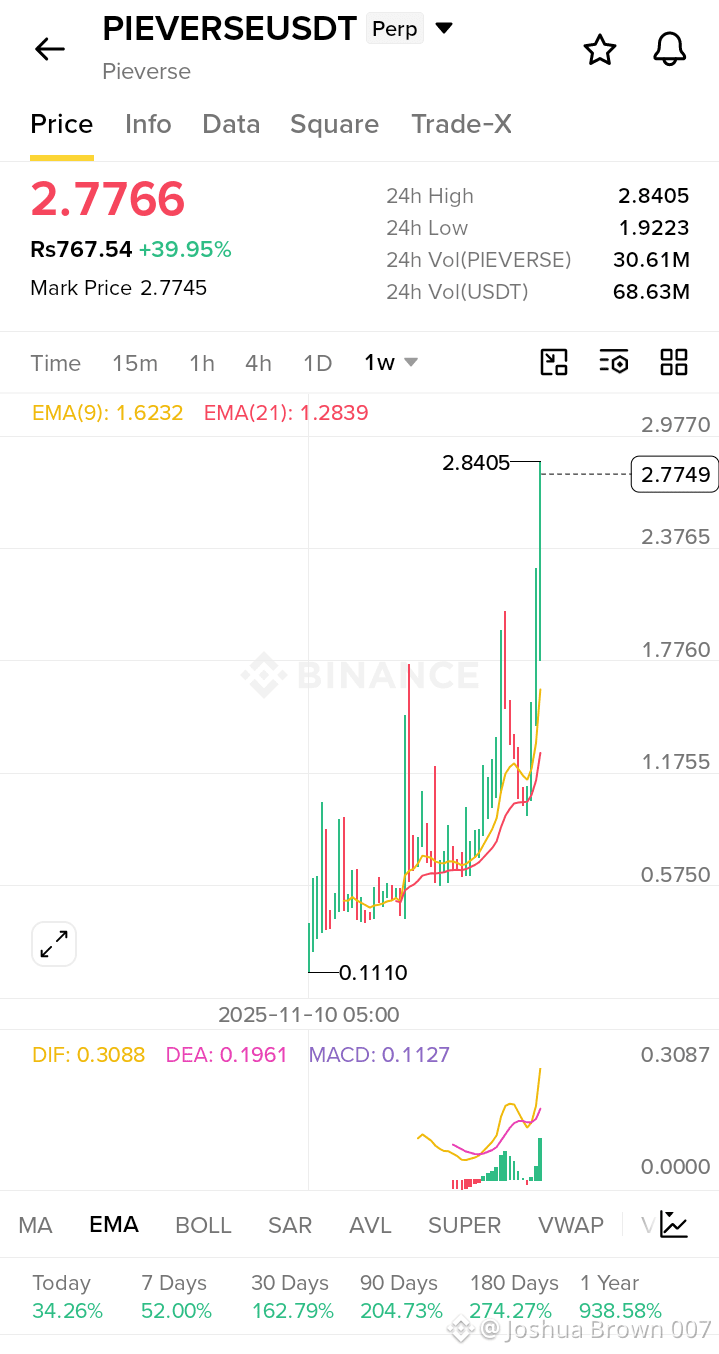
PIEVERSE is showing explosive momentum on the weekly chart. In the screenshot, price is trading around $2.7766, with an intraday high of $2.8405, while the 24-hour gain stands at nearly 40%.
📊 What is driving this rally?
• Strong speculative demand and renewed interest in AI-agent payment narratives. • The market appears to have absorbed recent token-unlock supply better than many traders expected. • Futures activity, thin liquidity and potential short covering can amplify upward moves. • Recent product-related developments and the AI-agent narrative may also be contributing, although there is no single confirmed catalyst explaining the entire rally.
📈 Technical picture:
On the weekly chart: • EMA 9: $1.6232 • EMA 21: $1.2839 • MACD remains strongly bullish. • Price is trading significantly above both EMAs, showing an extended momentum move.
⚠️ Where could rejection happen?
If buyers fail to sustain momentum around $2.80–$2.85, short-term profit-taking could begin.
Potential correction zones I am watching:
🔹 $2.60–$2.50 — First potential pullback zone.
🔹 $2.35–$2.20 — Stronger retracement area if selling accelerates.
🔹 $2.00–$1.85 — Deeper correction zone in case momentum weakens significantly.
If price breaks above $2.85 with strong volume and holds the breakout, further price discovery is possible. However, chasing a nearly 40% daily move can be dangerous.
A bullish chart doesn't mean a safe entry. After a vertical rally, protecting capital matters more than chasing candles.
I would watch volume, price reaction around $2.85–$2.88, and whether sellers can defend the breakout.
#PIEVERSE #Crypto #Trading #Altcoins #TechnicalAnalysis $PIEVERSE
PIEVERSE is showing explosive momentum on the weekly chart. In the screenshot, price is trading around $2.7766, with an intraday high of $2.8405, while the 24-hour gain stands at nearly 40%.
📊 What is driving this rally?
• Strong speculative demand and renewed interest in AI-agent payment narratives. • The market appears to have absorbed recent token-unlock supply better than many traders expected. • Futures activity, thin liquidity and potential short covering can amplify upward moves. • Recent product-related developments and the AI-agent narrative may also be contributing, although there is no single confirmed catalyst explaining the entire rally.
📈 Technical picture:
On the weekly chart: • EMA 9: $1.6232 • EMA 21: $1.2839 • MACD remains strongly bullish. • Price is trading significantly above both EMAs, showing an extended momentum move.
⚠️ Where could rejection happen?
If buyers fail to sustain momentum around $2.80–$2.85, short-term profit-taking could begin.
Potential correction zones I am watching:
🔹 $2.60–$2.50 — First potential pullback zone.
🔹 $2.35–$2.20 — Stronger retracement area if selling accelerates.
🔹 $2.00–$1.85 — Deeper correction zone in case momentum weakens significantly.
If price breaks above $2.85 with strong volume and holds the breakout, further price discovery is possible. However, chasing a nearly 40% daily move can be dangerous.
A bullish chart doesn't mean a safe entry. After a vertical rally, protecting capital matters more than chasing candles.
I would watch volume, price reaction around $2.85–$2.88, and whether sellers can defend the breakout.
#PIEVERSE #Crypto #Trading #Altcoins #TechnicalAnalysis $PIEVERSE