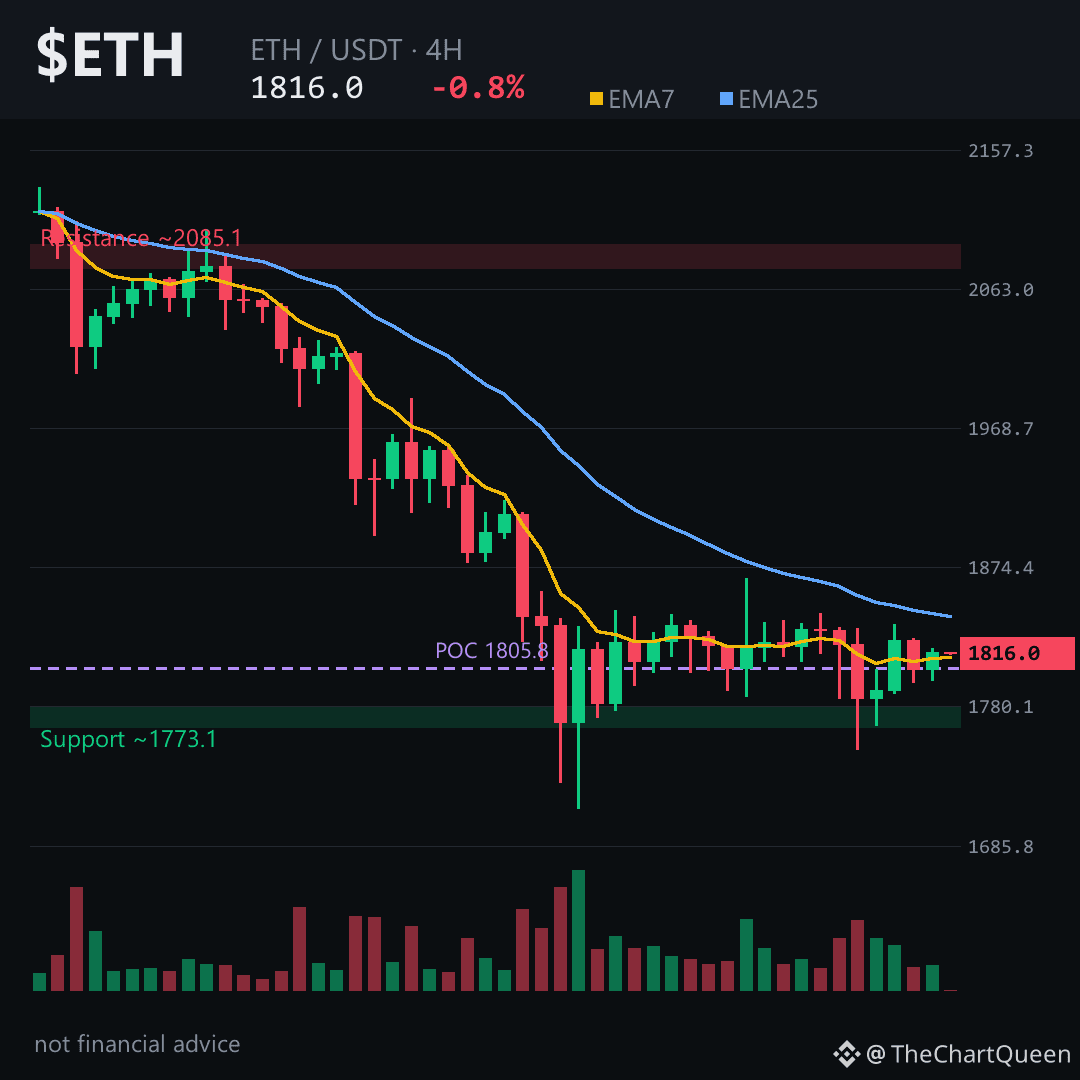
The 24h low at 1751 wasn't a fluke — it was a warning shot. $ETH has spent 48 hours building a ceiling around the mid-1830s, rejecting it five times, each rejection leaving less conviction behind. Price now hovers just above the 1805 volume pocket that has absorbed every dip this week. The bounce off 1751 looks like strength, but the daily moving averages still say sellers haven't finished.
Funding is barely positive, yet the long-short ratio is heavily skewed toward longs — nearly 2.5 to 1. That combination means the bounce is being bought with leverage, not spot conviction. Open interest is thin — smart money hasn't rushed back in. The 4h chart shows lower highs since the 1866 print, and the volume profile's most-traded level sits right at 1805 — a magnet that's holding, but barely.
There's an unfilled gap overhead spanning roughly 1845 to 1896 — a zone price has poked at but never closed through. If $ETH can't reclaim 1850 on a daily close, the path of least resistance remains downward. The next meaningful floor doesn't come in until the 1550 region, with the macro view pointing even lower toward 1068 if weekly structure breaks. That's not a prediction — it's where the liquidity vacuum sits.
My read: a bearish chart wearing a bullish mask. The invalidation is clean — a decisive daily close above the 1993 area flips the structure. Until then, rallies into the 1850-1900 band are likely to face selling pressure. Tap $ETH to pull up the chart and see the rejection zone yourself.
Follow me for the update when this 1805 pocket finally gives way — that's the level that tells us whether this is a correction or something deeper. What's the one level you're watching on ETH right now 👇
⚠️ Not financial advice. DYOR.
#ETH #Ethereum #Crypto #BinanceSquare
Funding is barely positive, yet the long-short ratio is heavily skewed toward longs — nearly 2.5 to 1. That combination means the bounce is being bought with leverage, not spot conviction. Open interest is thin — smart money hasn't rushed back in. The 4h chart shows lower highs since the 1866 print, and the volume profile's most-traded level sits right at 1805 — a magnet that's holding, but barely.
There's an unfilled gap overhead spanning roughly 1845 to 1896 — a zone price has poked at but never closed through. If $ETH can't reclaim 1850 on a daily close, the path of least resistance remains downward. The next meaningful floor doesn't come in until the 1550 region, with the macro view pointing even lower toward 1068 if weekly structure breaks. That's not a prediction — it's where the liquidity vacuum sits.
My read: a bearish chart wearing a bullish mask. The invalidation is clean — a decisive daily close above the 1993 area flips the structure. Until then, rallies into the 1850-1900 band are likely to face selling pressure. Tap $ETH to pull up the chart and see the rejection zone yourself.
Follow me for the update when this 1805 pocket finally gives way — that's the level that tells us whether this is a correction or something deeper. What's the one level you're watching on ETH right now 👇
⚠️ Not financial advice. DYOR.
#ETH #Ethereum #Crypto #BinanceSquare