Market Overview & Price Action
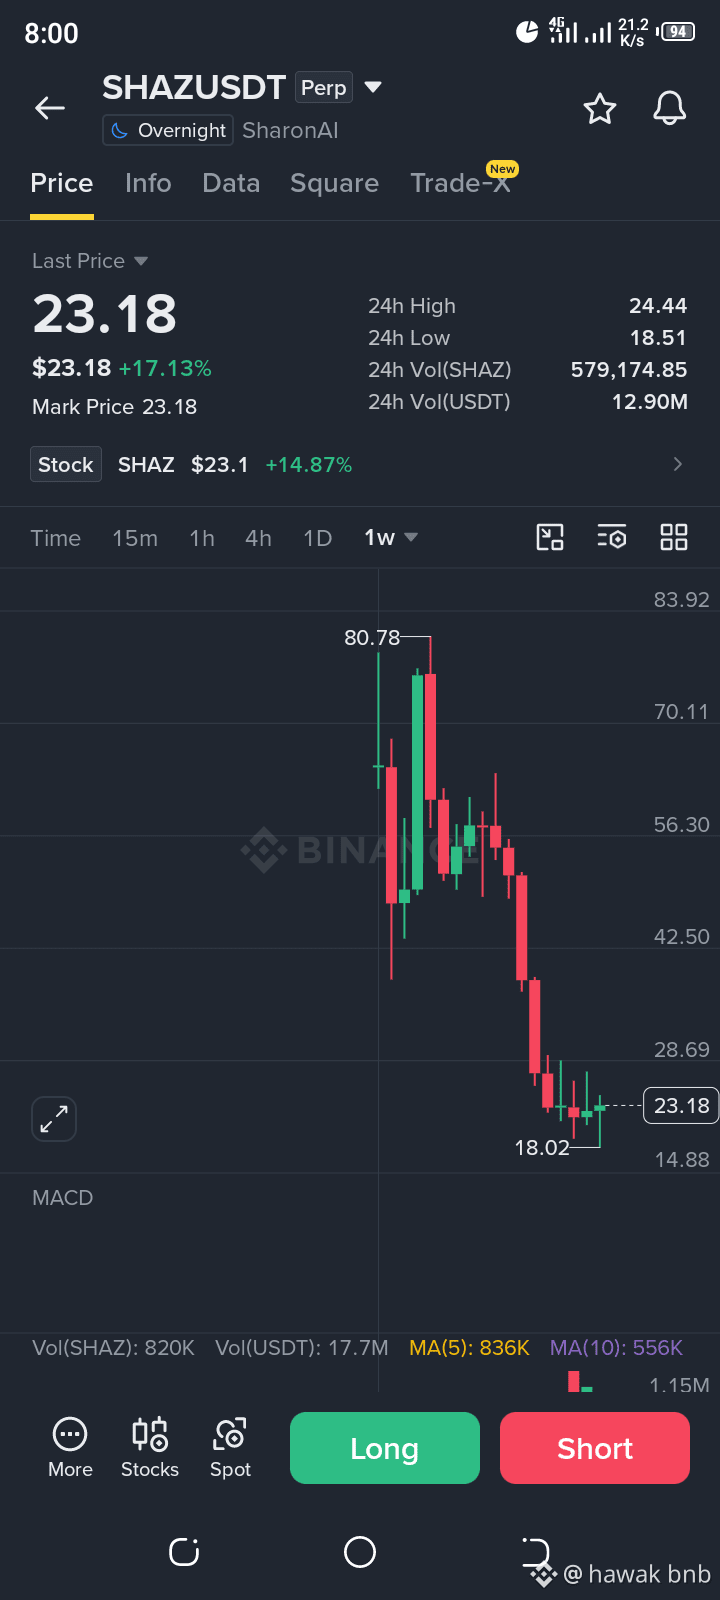
The screenshot displays a 1-week (1W) technical candlestick chart for SHAZ/USDT (SharonAI) on Binance. The current last traded price is $23.18, reflecting a solid weekly gain of +17.13% (with the stock-linked asset SHAZ trading at $23.1, up +14.87%). Despite this modest recovery candle, the broader macro chart structure reveals a substantial downward correction following a significant peak near the $80.78 level.
24-Hour Range & Trading Volume
Over the recent trading period, the asset recorded a 24-hour low of $18.51 (with the weekly wick touching a low of $18.02) and a 24-hour high of $24.44. Market participation and liquidity are supported by a 24-hour volume of 579,174.85 SHAZ and 12.90M USDT.
Technical Indicators & Volume Dynamics
Volume Moving Averages: The volume panel indicates an MA(5) of 836K compared to an MA(10) of 556K, reflecting a short-term increase in trading activity as buyers attempt to defend support levels near the $18.00 zone.
Macro Trend: The multi-week price candles clearly demonstrate a heavy bearish descent from the $80+ high down to the current $23 region, indicating that the asset remains in a long-term corrective phase despite minor bounce attempts. @shaz #SHAZUSDT $SHAZ
#CanNvidia’sDataCenterGrowthContinue? #NvidiaBoardNotConsideringHuang’sReturnasCEO #KOSPIFalls2.59%ToLowestCloseSinceFebruary #AnthropicClearedToListOnNasdaqAsANT
The screenshot displays a 1-week (1W) technical candlestick chart for SHAZ/USDT (SharonAI) on Binance. The current last traded price is $23.18, reflecting a solid weekly gain of +17.13% (with the stock-linked asset SHAZ trading at $23.1, up +14.87%). Despite this modest recovery candle, the broader macro chart structure reveals a substantial downward correction following a significant peak near the $80.78 level.
24-Hour Range & Trading Volume
Over the recent trading period, the asset recorded a 24-hour low of $18.51 (with the weekly wick touching a low of $18.02) and a 24-hour high of $24.44. Market participation and liquidity are supported by a 24-hour volume of 579,174.85 SHAZ and 12.90M USDT.
Technical Indicators & Volume Dynamics
Volume Moving Averages: The volume panel indicates an MA(5) of 836K compared to an MA(10) of 556K, reflecting a short-term increase in trading activity as buyers attempt to defend support levels near the $18.00 zone.
Macro Trend: The multi-week price candles clearly demonstrate a heavy bearish descent from the $80+ high down to the current $23 region, indicating that the asset remains in a long-term corrective phase despite minor bounce attempts. @shaz #SHAZUSDT $SHAZ
#CanNvidia’sDataCenterGrowthContinue? #NvidiaBoardNotConsideringHuang’sReturnasCEO #KOSPIFalls2.59%ToLowestCloseSinceFebruary #AnthropicClearedToListOnNasdaqAsANT