Imagine a balloon that’s been punctured — not popped, just leaking air in slow, dramatic bursts. That’s $VIB right now.
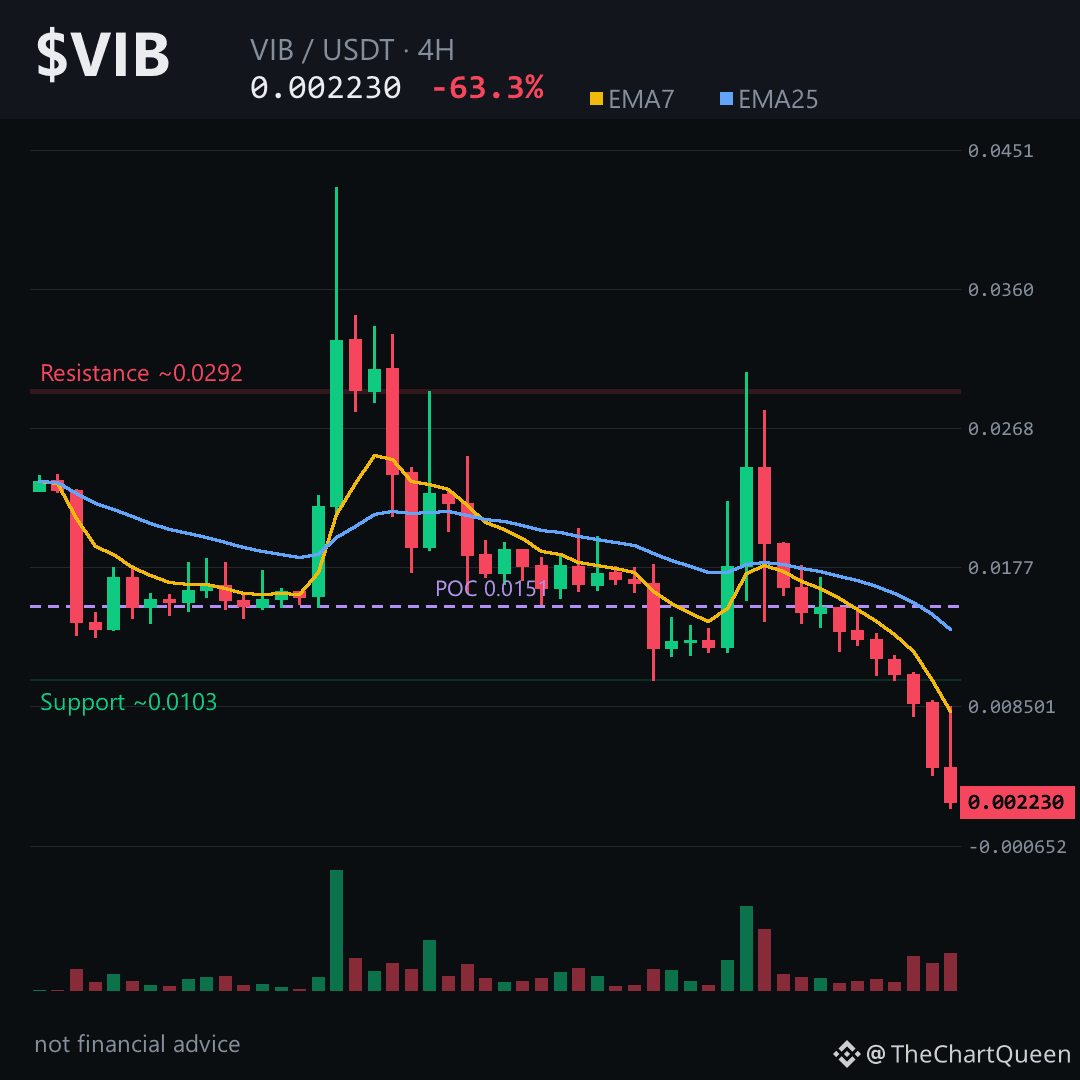
A 63% single-day collapse isn’t a correction; it’s a structural break. The 4-hour chart printed a massive unfilled gap — a bearish void between roughly 0.0102 and 0.0089 — the kind of air pocket price often revisits only after exhausting the downside first.
Price is crushed below both moving averages, momentum deep in oversold territory — a zone that can spark a dead-cat bounce, rarely a true reversal without a base. The volume profile’s heaviest traded area sits far above, around 0.015, meaning anyone who bought the “dip” earlier is now underwater and likely watching for an exit, not adding.
The levels that matter: the current area near 0.0022 is a fragile ledge after a -50% candle. If this read holds, the objective zone stretches toward the 0.0020 area, with the real trap being any push back above roughly 0.00235. Lose that 0.00235 zone on a 4-hour close and the bearish structure starts to crack.
My read: the chart is telling a story of cascading exits, not accumulation. The risk isn’t missing a bounce — it’s mistaking exhaustion for reversal.
I’ll be watching whether 0.0020 gets tested or if the gap above starts pulling price back like a magnet. Follow along — I’ll share an updated read as this range resolves 👇
What’s your take on $VIB — are you watching the gap above or the ledge below?
⚠️ Not financial advice. DYOR.
#VIB #Crypto #BinanceSquare
A 63% single-day collapse isn’t a correction; it’s a structural break. The 4-hour chart printed a massive unfilled gap — a bearish void between roughly 0.0102 and 0.0089 — the kind of air pocket price often revisits only after exhausting the downside first.
Price is crushed below both moving averages, momentum deep in oversold territory — a zone that can spark a dead-cat bounce, rarely a true reversal without a base. The volume profile’s heaviest traded area sits far above, around 0.015, meaning anyone who bought the “dip” earlier is now underwater and likely watching for an exit, not adding.
The levels that matter: the current area near 0.0022 is a fragile ledge after a -50% candle. If this read holds, the objective zone stretches toward the 0.0020 area, with the real trap being any push back above roughly 0.00235. Lose that 0.00235 zone on a 4-hour close and the bearish structure starts to crack.
My read: the chart is telling a story of cascading exits, not accumulation. The risk isn’t missing a bounce — it’s mistaking exhaustion for reversal.
I’ll be watching whether 0.0020 gets tested or if the gap above starts pulling price back like a magnet. Follow along — I’ll share an updated read as this range resolves 👇
What’s your take on $VIB — are you watching the gap above or the ledge below?
⚠️ Not financial advice. DYOR.
#VIB #Crypto #BinanceSquare