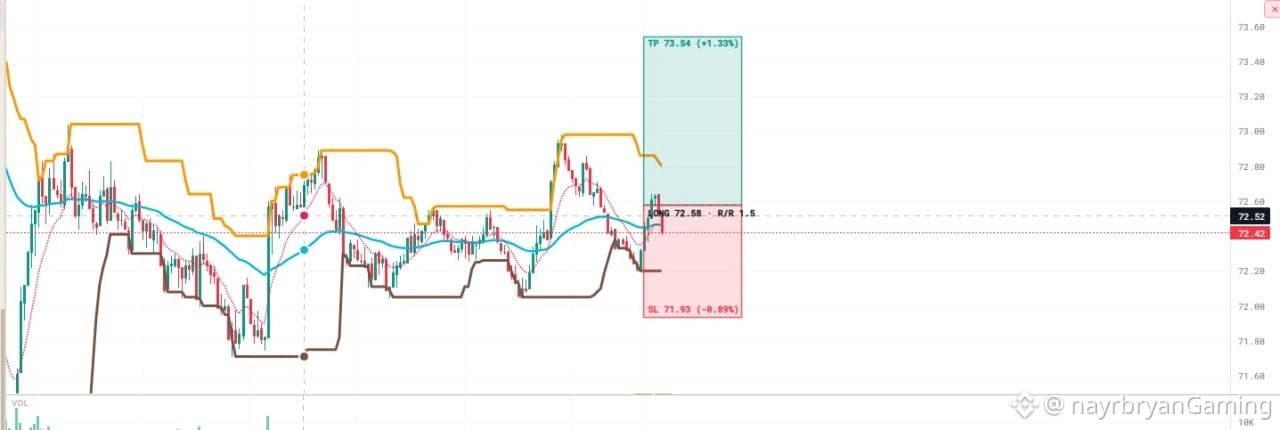
LIGHT ANALYSIS / CHART SETUP — SOL/USDT
📈 STRUCTURE OVERVIEW
Market Phase:
Pullback → Recovery → Potential bullish continuation
Current Visible Price:
Approximately 72.42
Entry Reference:
72.58
Take-Profit:
73.54
Stop-Loss:
71.93
Potential Return:
+1.33%
Potential Risk:
-0.89%
Risk/Reward:
Approximately 1.5R
---
📌 WHAT I'M WATCHING
SCENARIO A — BULLISH CONTINUATION
If SOL reclaims 72.58 and establishes sustained bullish momentum, the next projected objective is:
73.54
Watch for:
• Strong bullish candle confirmation.
• Sustained price action above entry.
• Continued momentum.
• Resistance breakout confirmation.
SCENARIO B — BEARISH INVALIDATION
If SOL loses the lower support structure and reaches 71.93, the illustrated bullish setup is invalidated.
Do not assume the bullish scenario remains valid after the predefined stop-loss is reached.
---
📊 INDICATOR CHECK
Upper Dynamic Resistance:
Orange indicator line.
Middle Dynamic Reference:
Cyan indicator line.
Lower Dynamic Support:
Brown indicator line.
Entry Reference:
72.58.
TP:
73.54.
SL:
71.93.
---
📝 CHART NOTE
The setup presents a potential bullish recovery with a predefined target and invalidation.
The important factor is whether buyers can establish acceptance above the entry reference.
Wait for confirmation instead of chasing the initial recovery candle.
This is an educational chart framework, not a trade recommendation.
— @nayrbryanGaming
#SOLAnalysis #ChartSetup #TechnicalAnalysis #PriceAction #CryptoTrading #RiskReward #DYOR #NFA
📈 STRUCTURE OVERVIEW
Market Phase:
Pullback → Recovery → Potential bullish continuation
Current Visible Price:
Approximately 72.42
Entry Reference:
72.58
Take-Profit:
73.54
Stop-Loss:
71.93
Potential Return:
+1.33%
Potential Risk:
-0.89%
Risk/Reward:
Approximately 1.5R
---
📌 WHAT I'M WATCHING
SCENARIO A — BULLISH CONTINUATION
If SOL reclaims 72.58 and establishes sustained bullish momentum, the next projected objective is:
73.54
Watch for:
• Strong bullish candle confirmation.
• Sustained price action above entry.
• Continued momentum.
• Resistance breakout confirmation.
SCENARIO B — BEARISH INVALIDATION
If SOL loses the lower support structure and reaches 71.93, the illustrated bullish setup is invalidated.
Do not assume the bullish scenario remains valid after the predefined stop-loss is reached.
---
📊 INDICATOR CHECK
Upper Dynamic Resistance:
Orange indicator line.
Middle Dynamic Reference:
Cyan indicator line.
Lower Dynamic Support:
Brown indicator line.
Entry Reference:
72.58.
TP:
73.54.
SL:
71.93.
---
📝 CHART NOTE
The setup presents a potential bullish recovery with a predefined target and invalidation.
The important factor is whether buyers can establish acceptance above the entry reference.
Wait for confirmation instead of chasing the initial recovery candle.
This is an educational chart framework, not a trade recommendation.
— @nayrbryanGaming
#SOLAnalysis #ChartSetup #TechnicalAnalysis #PriceAction #CryptoTrading #RiskReward #DYOR #NFA