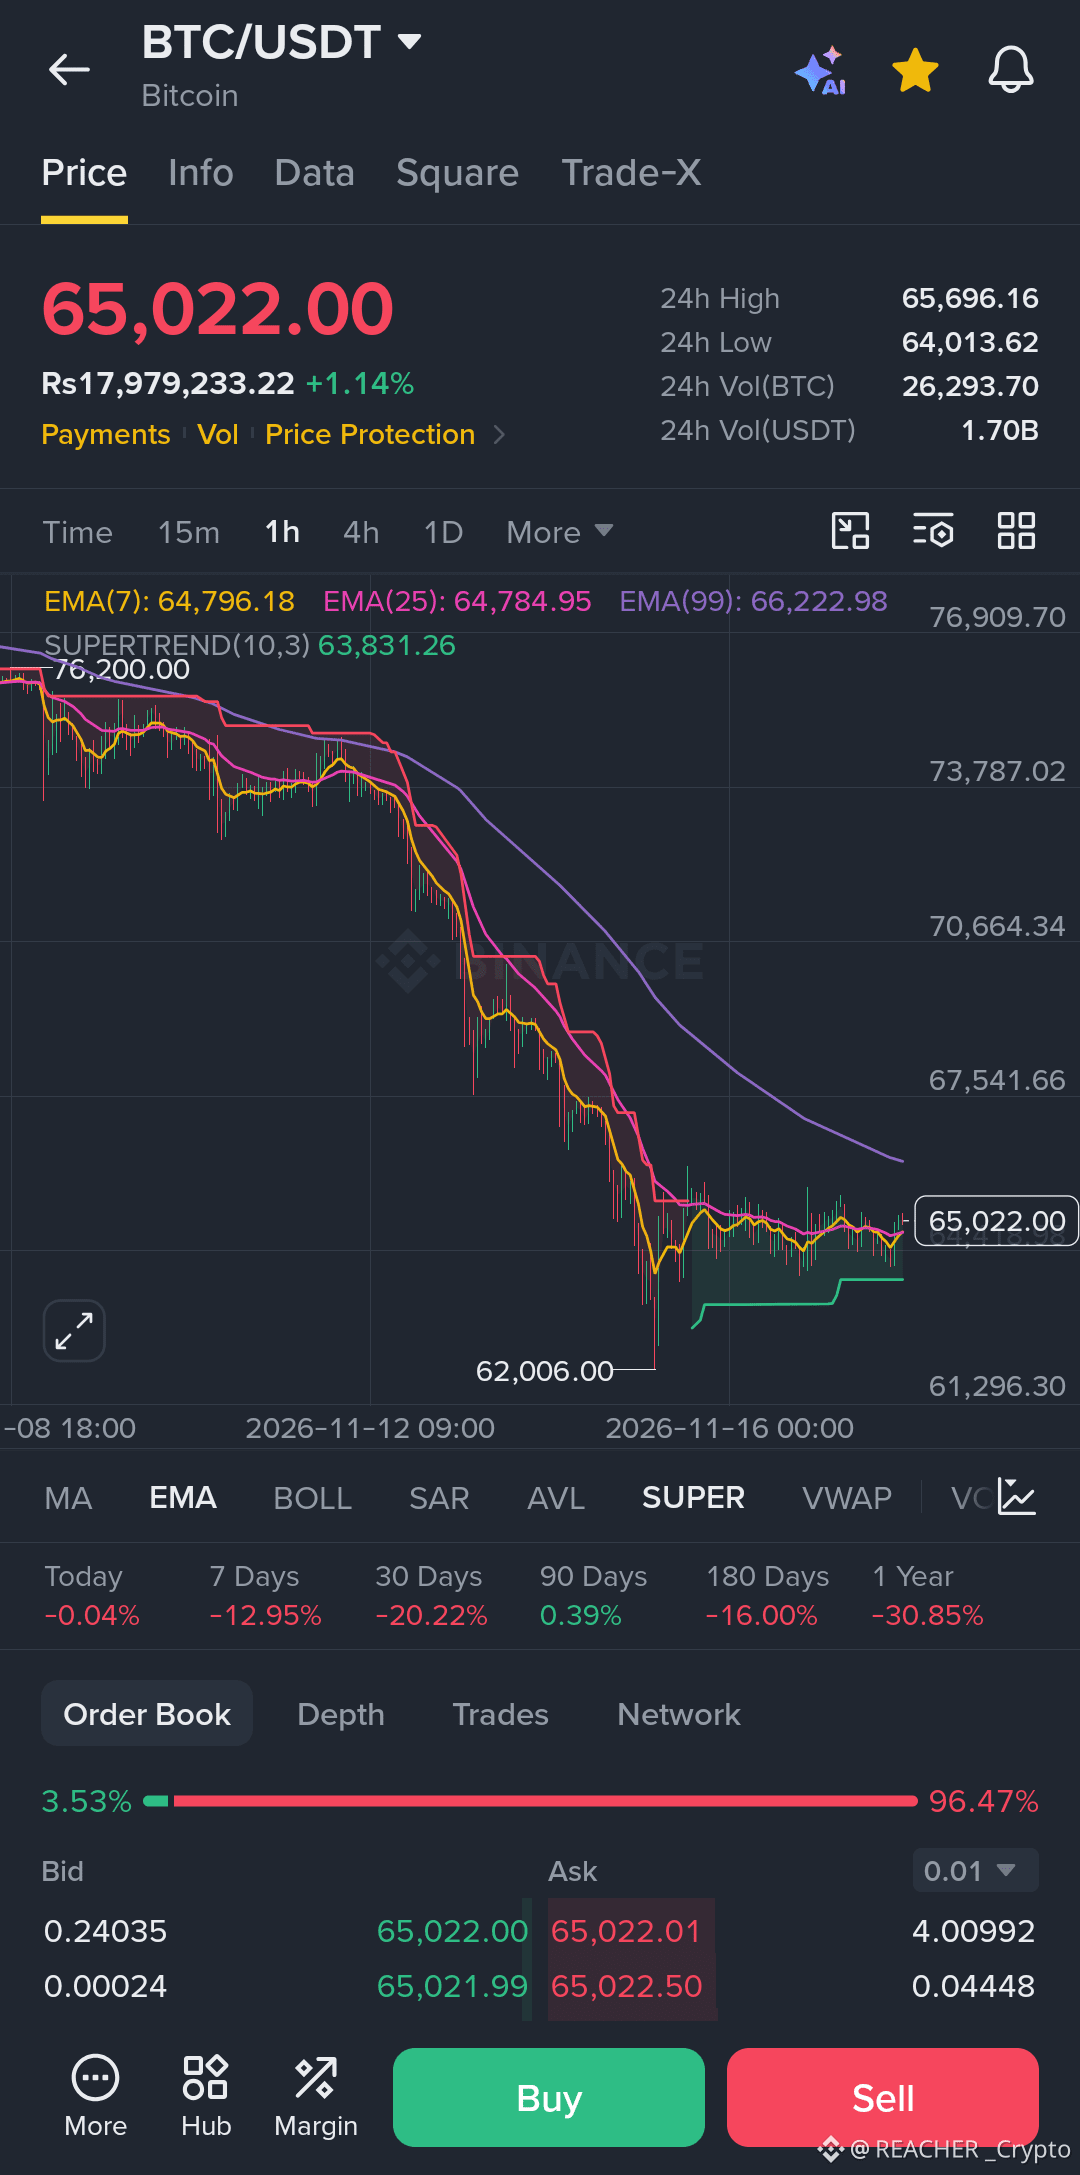
The first thing I ask myself looking at this BTC chart is whether I’d actually risk my own money here right now. Honestly, the answer is no—not in the middle of this heavy sell-off. But it’s a perfect example of why waiting for confirmation matters.
Looking at the 1-hour timeframe, the macro trend is clearly bearish. We’ve bled from the 76,200 peak, and the recent price action is pure capitulation. A heavy drop just sliced straight through support, tagging a low of 62,006. Right now, price is hovering at 65,022, and the moving averages are stacked heavily above us. The EMA7 (64,796), EMA25 (64,784), and EMA99 (66,222) are all acting as dynamic resistance.
This is a textbook bearish alignment. When price goes vertical like this, there is very little structural support underneath it.
A lesson I’ve learned from taking too many early entries is that oversold does not always mean it’s time to buy. I always let the market prove it can find a floor before entering.
Trade Plan:
Bias: Bearish (Waiting for a dead-cat bounce or structural base).
Entry Zone: 65,700 – 66,000 (Looking for a retracement to the EMA cluster, only if it forms a clear rejection).
Stop Loss: 67,500 (Above the previous breakdown block).
Target 1: 62,006 (Recent low).
Target 2: 60,000 (Psychological support).
Target 3: 58,000 (Extended target).
Risk/Reward: 1:2.5
Invalidation: A 1H candle close back above 67,000, signaling a massive V-shaped reversal.
Do not FOMO into a falling candle. Wait for the market to cool off, respect your stop loss, and never risk more than you can afford to lose.
Would you dare to catch this falling knife, or are you waiting for a clear reversal signal?
$BTC
#NvidiaEarningsTonight:AIStocks’NextMove? #KOSPIFalls2.59%ToLowestCloseSinceFebruary #NvidiaBoardNotConsideringHuang’sReturnasCEO #WhatInvestmentSignalsDo13FFilingsReveal?
Looking at the 1-hour timeframe, the macro trend is clearly bearish. We’ve bled from the 76,200 peak, and the recent price action is pure capitulation. A heavy drop just sliced straight through support, tagging a low of 62,006. Right now, price is hovering at 65,022, and the moving averages are stacked heavily above us. The EMA7 (64,796), EMA25 (64,784), and EMA99 (66,222) are all acting as dynamic resistance.
This is a textbook bearish alignment. When price goes vertical like this, there is very little structural support underneath it.
A lesson I’ve learned from taking too many early entries is that oversold does not always mean it’s time to buy. I always let the market prove it can find a floor before entering.
Trade Plan:
Bias: Bearish (Waiting for a dead-cat bounce or structural base).
Entry Zone: 65,700 – 66,000 (Looking for a retracement to the EMA cluster, only if it forms a clear rejection).
Stop Loss: 67,500 (Above the previous breakdown block).
Target 1: 62,006 (Recent low).
Target 2: 60,000 (Psychological support).
Target 3: 58,000 (Extended target).
Risk/Reward: 1:2.5
Invalidation: A 1H candle close back above 67,000, signaling a massive V-shaped reversal.
Do not FOMO into a falling candle. Wait for the market to cool off, respect your stop loss, and never risk more than you can afford to lose.
Would you dare to catch this falling knife, or are you waiting for a clear reversal signal?
$BTC
#NvidiaEarningsTonight:AIStocks’NextMove? #KOSPIFalls2.59%ToLowestCloseSinceFebruary #NvidiaBoardNotConsideringHuang’sReturnasCEO #WhatInvestmentSignalsDo13FFilingsReveal?