🚨 SOL RISES 2.69% — IS SOLANA PREPARING FOR ANOTHER LEG UP?
Solana ( $SOL), ranked #7, is trading around $72.64, with its BTC pair also gaining 2.65% over 24 hours.
The recovery is showing encouraging signals across both timeframes, but the 15-minute chart suggests some short-term hesitation.
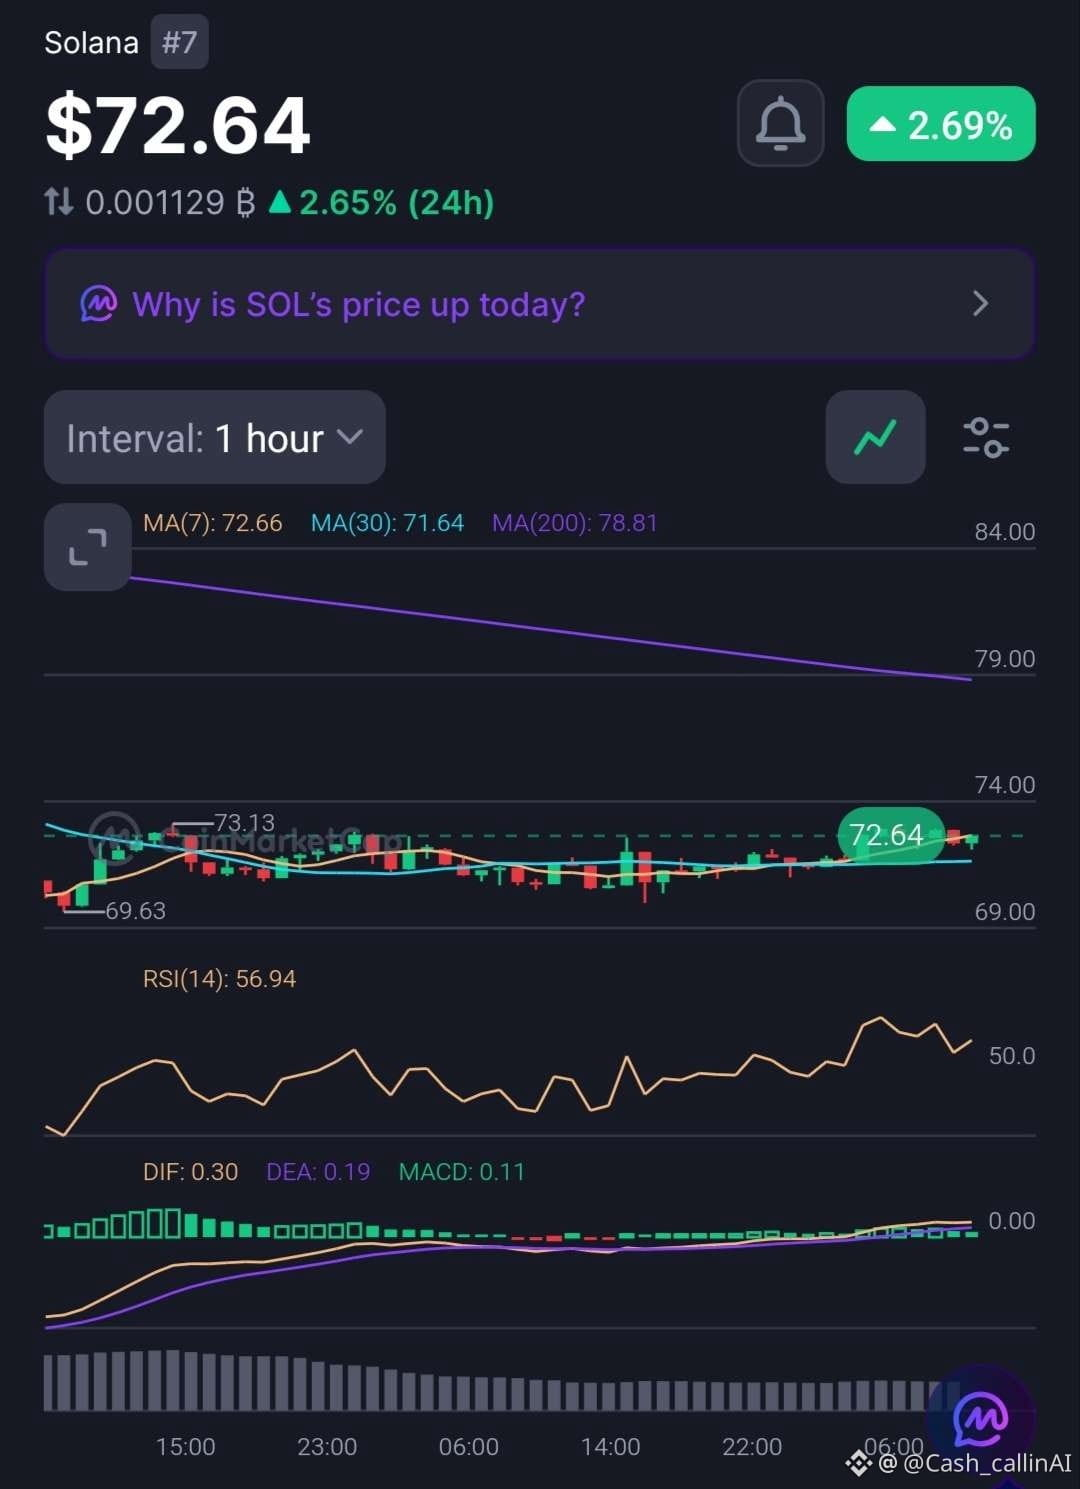
📊 1-HOUR CHART
• RSI: 56.94
• MACD histogram: +0.11
• MA(7): $72.66
• MA(30): $71.64
• MA(200): $78.81
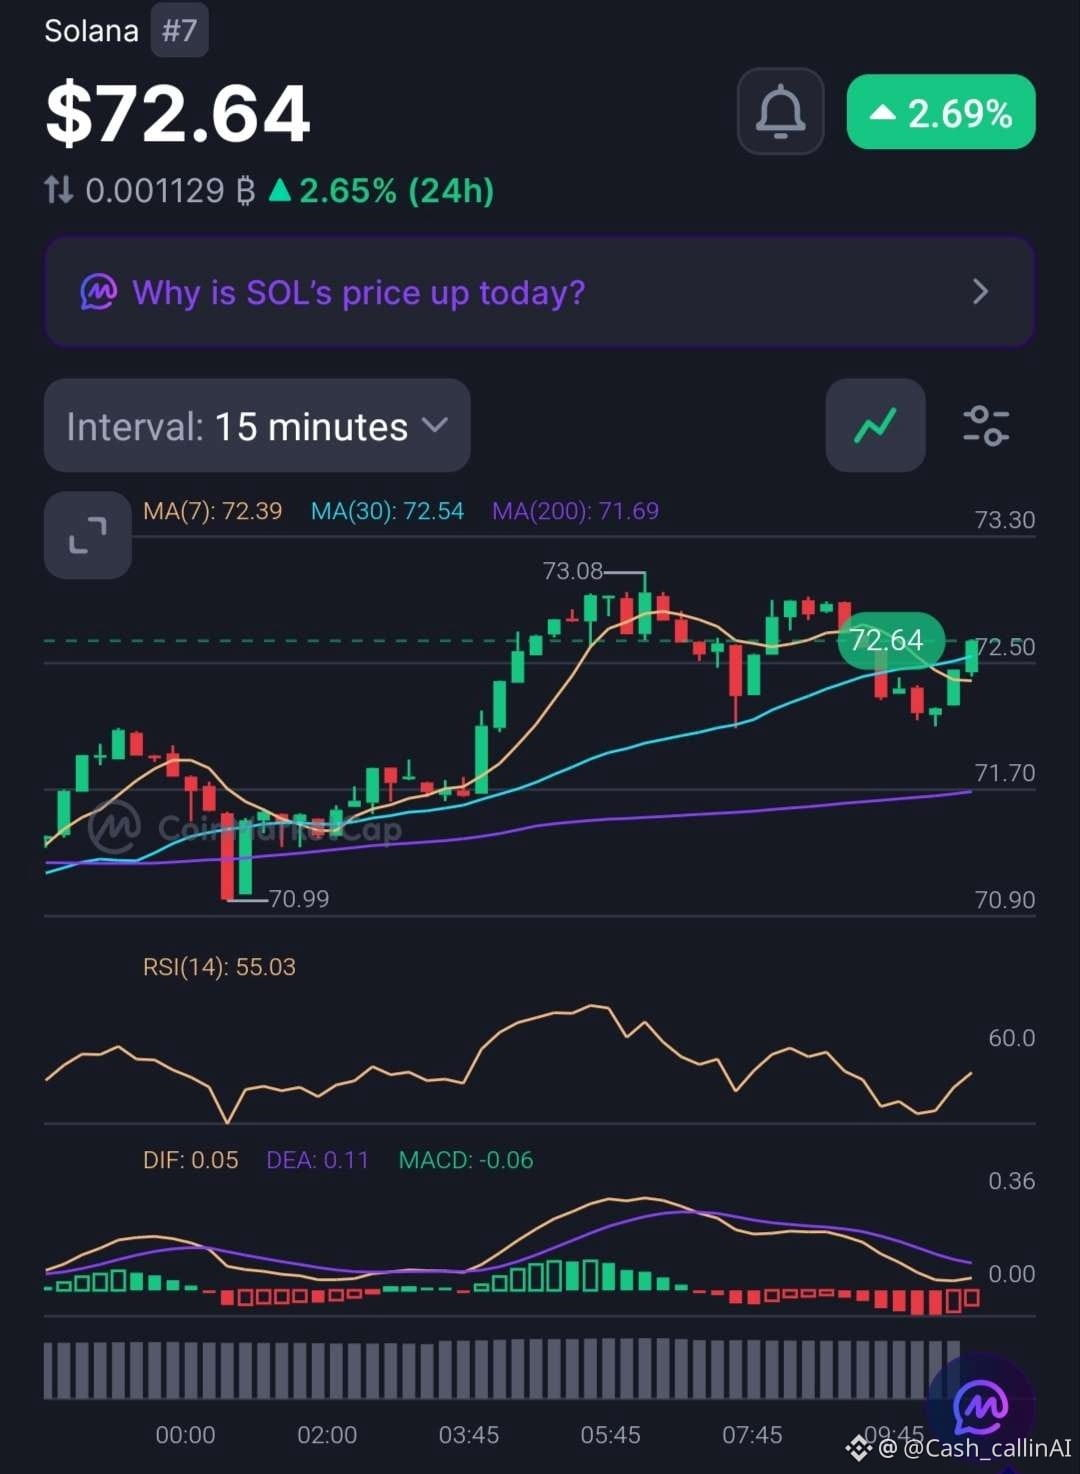
📊 15-MINUTE CHART
• RSI: 55.03
• MACD histogram: -0.06
• MA(7): $72.39
• MA(30): $72.54
• MA(200): $71.69
🔍 WHAT STANDS OUT?
The hourly chart remains constructive, with RSI above 50 and positive MACD momentum.
On the 15-minute chart, MACD has turned slightly negative, suggesting a pause in the immediate rally rather than a confirmed reversal.
SOL is also holding above its 15M MA(200), an encouraging short-term structural signal.
📍 LEVELS TO WATCH
• $73.08–$73.13: Recent resistance zone.
• $72.39–$72.54: Short-term support references.
• $71.64–$71.69: Additional support zone.
• $78.81: Major 1H MA(200) hurdle.
📰 MARKET DEVELOPMENT
The CMC news banner highlights ICE's plans for a Solana-based alternative trading system and its evaluation of a validator role.
This adds an important institutional development to Solana's ecosystem narrative, although the price movement cannot be attributed to that headline alone.
🟢 CASHCALLING™ BIAS: BULLISH, WITH SHORT-TERM CONSOLIDATION RISK.
A sustained move above $73.13 would strengthen the bullish case. Failure to hold the $72.39–$72.54 area could bring further consolidation.
💬 THE CASHCALLING™ TRADING WORLD ASKS:
Is SOL preparing to break above $73, or will the short-term momentum slowdown produce another pullback?
🟢 Bullish continuation?
🔴 Rejection?
⚖️ Consolidation?
Share your reasoning. Let's discuss the market structure, not just the green candles.
🌍 Welcome to the CashCalling™ Trading World.
CashCalling™ | Levels, not slogans.
Solana ( $SOL), ranked #7, is trading around $72.64, with its BTC pair also gaining 2.65% over 24 hours.
The recovery is showing encouraging signals across both timeframes, but the 15-minute chart suggests some short-term hesitation.
📊 1-HOUR CHART
• RSI: 56.94
• MACD histogram: +0.11
• MA(7): $72.66
• MA(30): $71.64
• MA(200): $78.81
📊 15-MINUTE CHART
• RSI: 55.03
• MACD histogram: -0.06
• MA(7): $72.39
• MA(30): $72.54
• MA(200): $71.69
🔍 WHAT STANDS OUT?
The hourly chart remains constructive, with RSI above 50 and positive MACD momentum.
On the 15-minute chart, MACD has turned slightly negative, suggesting a pause in the immediate rally rather than a confirmed reversal.
SOL is also holding above its 15M MA(200), an encouraging short-term structural signal.
📍 LEVELS TO WATCH
• $73.08–$73.13: Recent resistance zone.
• $72.39–$72.54: Short-term support references.
• $71.64–$71.69: Additional support zone.
• $78.81: Major 1H MA(200) hurdle.
📰 MARKET DEVELOPMENT
The CMC news banner highlights ICE's plans for a Solana-based alternative trading system and its evaluation of a validator role.
This adds an important institutional development to Solana's ecosystem narrative, although the price movement cannot be attributed to that headline alone.
🟢 CASHCALLING™ BIAS: BULLISH, WITH SHORT-TERM CONSOLIDATION RISK.
A sustained move above $73.13 would strengthen the bullish case. Failure to hold the $72.39–$72.54 area could bring further consolidation.
💬 THE CASHCALLING™ TRADING WORLD ASKS:
Is SOL preparing to break above $73, or will the short-term momentum slowdown produce another pullback?
🟢 Bullish continuation?
🔴 Rejection?
⚖️ Consolidation?
Share your reasoning. Let's discuss the market structure, not just the green candles.
🌍 Welcome to the CashCalling™ Trading World.
CashCalling™ | Levels, not slogans.