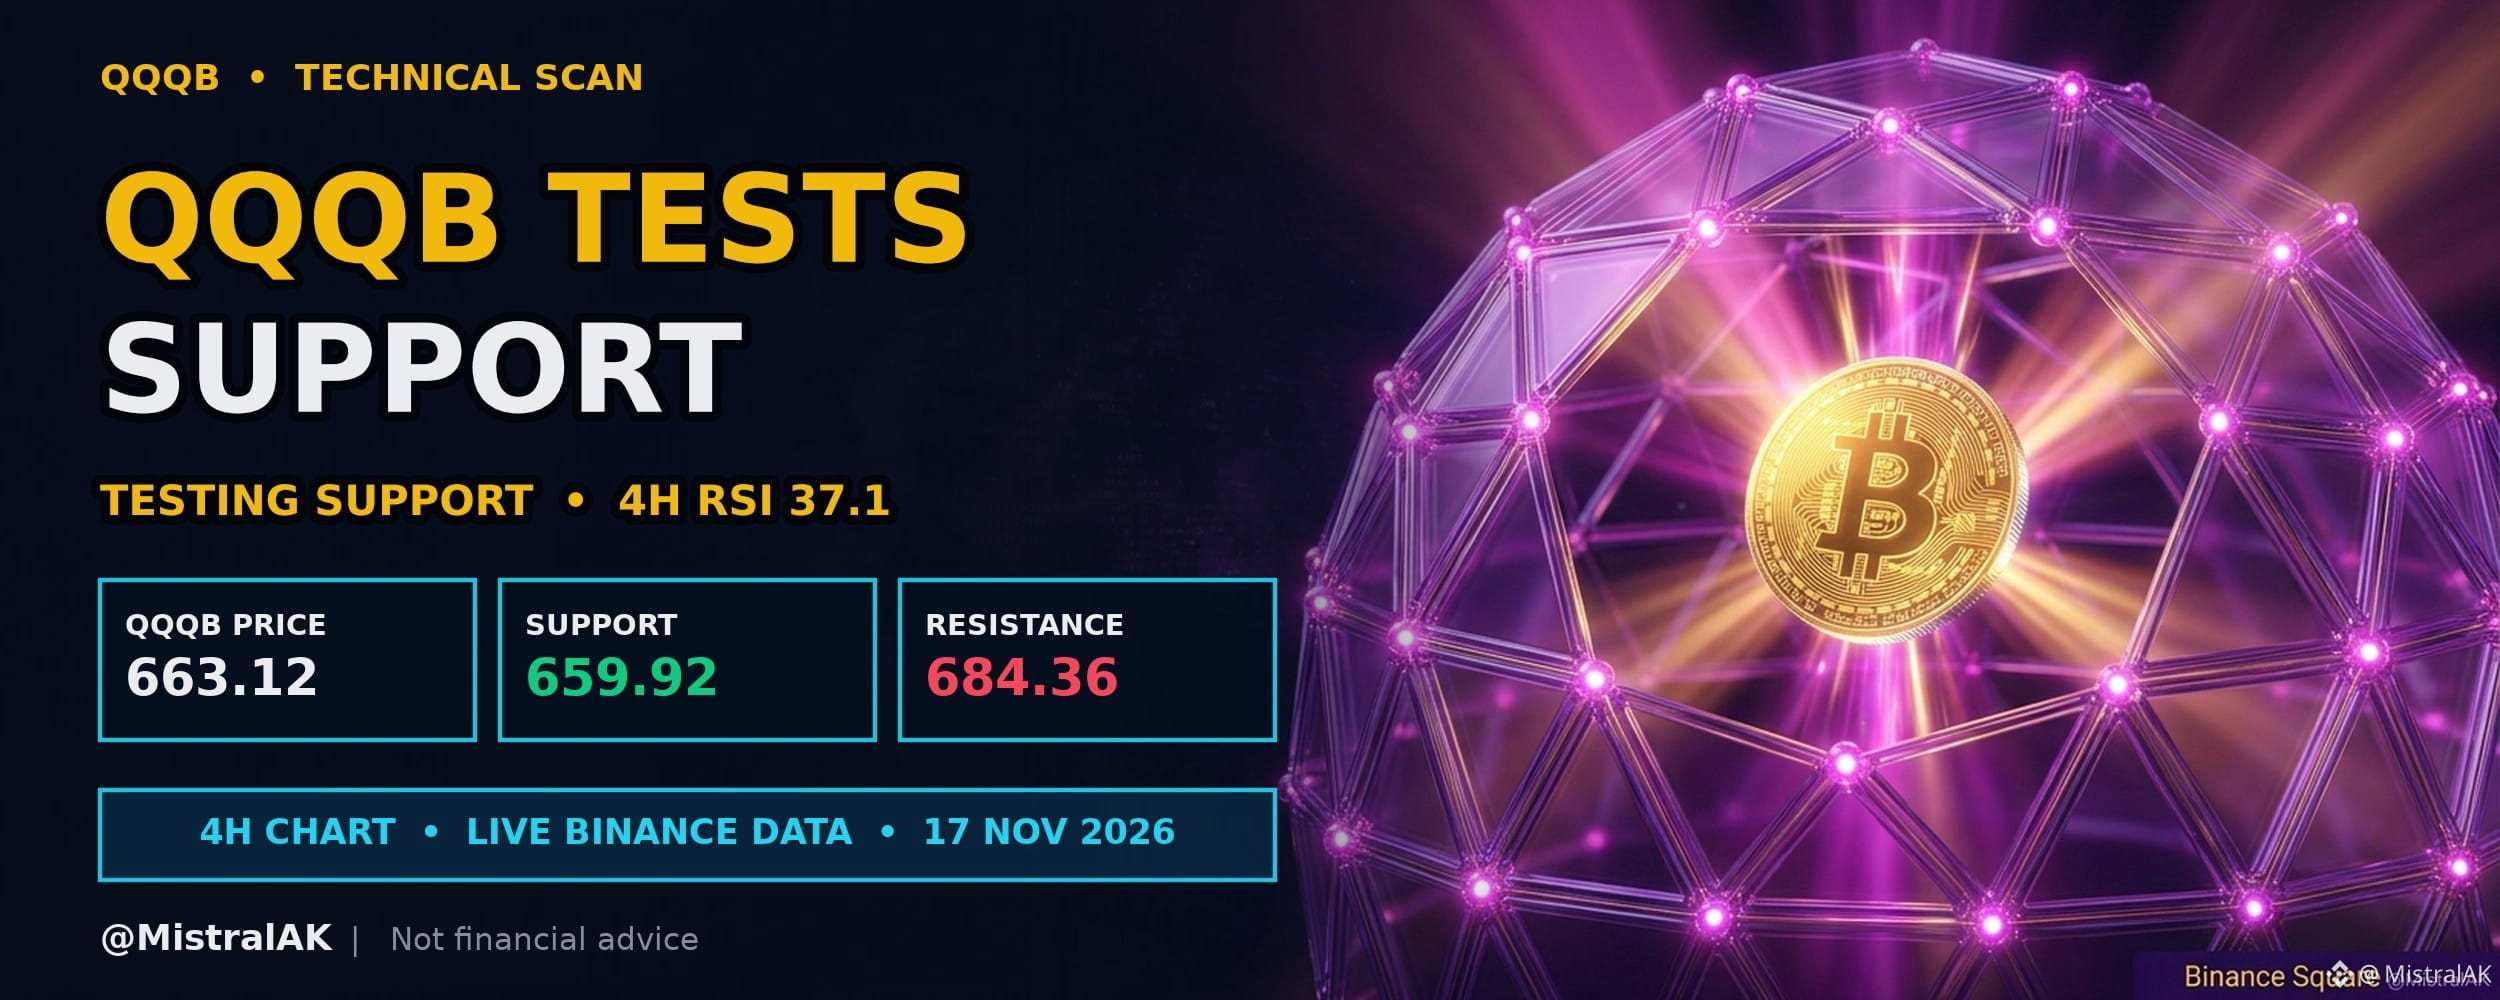
$QQQB Price Tests Twenty Candle Swing Low After Decline
$QQQB trades at 663.12 USD, down 2.8% over the past 24 hours, with 4H RSI at 37.1 (neutral).
Downward movement over the past twenty-four hours brings price to test its recent twenty-candle swing low. The four-hour relative strength index remains balanced, giving traders a clear baseline to watch for either a rebound or a breakdown.
TECHNICAL READ
▪️ Momentum: 4H RSI 37.1 sits in the neutral zone
▪️ Trend filter: EMA 20 is below EMA 50, and price is below EMA 20
▪️ Range: price is 3.2% below the range high and 0.5% above the range low
WHAT WOULD CONFIRM A HOLD
▪️ 4H candles defending 659.92 USD with a recovery above EMA 20 (672.33 USD)
▪️ RSI turning up from its lows
WHAT WOULD INVALIDATE IT
▪️ A 4H close below 659.92 USD
▪️ A bounce that stalls under EMA 20
Do you expect the recent swing low to hold or break on the four-hour chart?
Not financial advice. Always DYOR.
Like & Follow for Daily Trade Analytics & Insider News. @MistralAK
#QQQB #TradingSignals #HotTrends
$QQQB trades at 663.12 USD, down 2.8% over the past 24 hours, with 4H RSI at 37.1 (neutral).
Downward movement over the past twenty-four hours brings price to test its recent twenty-candle swing low. The four-hour relative strength index remains balanced, giving traders a clear baseline to watch for either a rebound or a breakdown.
TECHNICAL READ
▪️ Momentum: 4H RSI 37.1 sits in the neutral zone
▪️ Trend filter: EMA 20 is below EMA 50, and price is below EMA 20
▪️ Range: price is 3.2% below the range high and 0.5% above the range low
WHAT WOULD CONFIRM A HOLD
▪️ 4H candles defending 659.92 USD with a recovery above EMA 20 (672.33 USD)
▪️ RSI turning up from its lows
WHAT WOULD INVALIDATE IT
▪️ A 4H close below 659.92 USD
▪️ A bounce that stalls under EMA 20
Do you expect the recent swing low to hold or break on the four-hour chart?
Not financial advice. Always DYOR.
Like & Follow for Daily Trade Analytics & Insider News. @MistralAK
#QQQB #TradingSignals #HotTrends