🌪️ $UVXYB Surges 12.92% — Is Volatility Heating Up Again? 📈
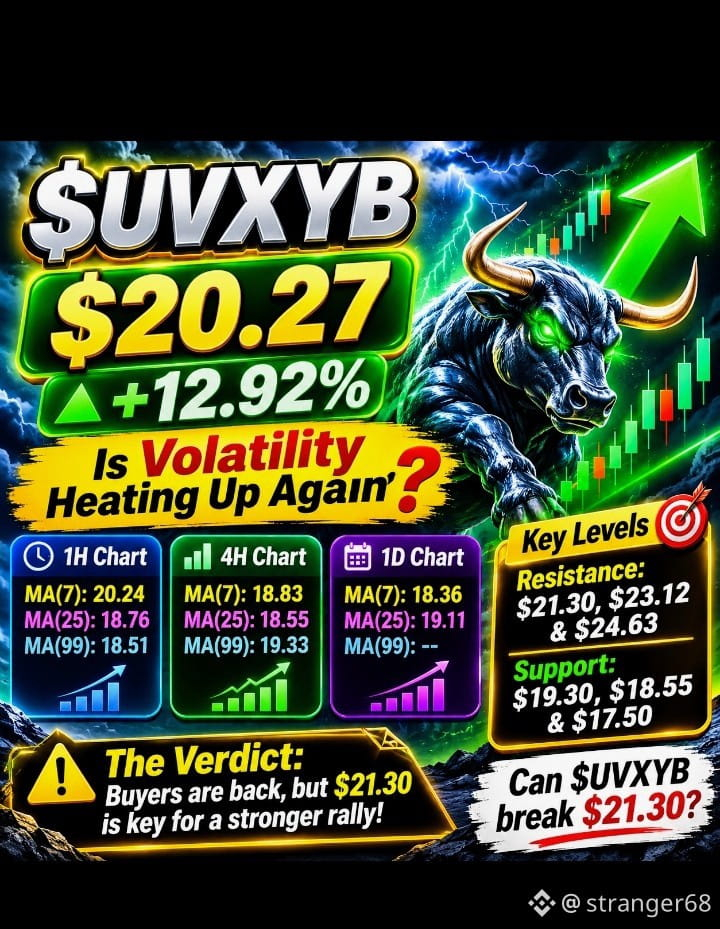
⚡ $UVXYB has climbed to $20.27 (+12.92%), with a 24-hour high of $21.30. After recovering strongly from $17.50, buyers have stepped in aggressively. The latest volume spike suggests renewed market activity, but can this rally hold? 🔥
⏱️ 1H Chart: Short-term momentum is improving. Price is trading at $20.27, above MA(7) at $20.24, MA(25) at $18.76, and MA(99) at $18.51. Holding above $20.24 could support another attempt toward $21.30. 📊
📈 4H Chart: Recovery is gaining strength, with price above MA(7) at $18.83 and MA(25) at $18.55, but still above MA(99) at $19.33. The $21.22 area is the next important resistance, while $19.30 is a key level to watch. 🚀
🌍 1D Chart: The daily structure remains highly volatile following the spike toward $24.63. Price is above MA(7) at $18.36 and MA(25) at $19.11, but the negative MACD reading signals that momentum still needs confirmation. ⚠️
🎯 Key Levels: Resistance: $21.30, $23.12 and $24.63. Support: $19.30, $18.55 and $17.50. 🔑
⚡ The Verdict: Buyers are showing renewed strength, but a sustained move above $21.30 would provide a stronger bullish signal. Remember, UVXYB is a leveraged volatility-linked product and can experience sharp price swings and significant losses.
❓Can $UVXYB break $21.30 and make another run toward $24.63, or is a pullback coming? 🌪️
#UVXYB #VolatilityTrading #MarketAnalysis
#HuangReportedlyConsidersReturnToNvidia #AnthropicIPOTestsInvestorAppetiteForAI #BitcoinExtendsLosingStreakToSixWeeks #MUFGSMFGMizuhoPlanYenBackedStablecoin
⚡ $UVXYB has climbed to $20.27 (+12.92%), with a 24-hour high of $21.30. After recovering strongly from $17.50, buyers have stepped in aggressively. The latest volume spike suggests renewed market activity, but can this rally hold? 🔥
⏱️ 1H Chart: Short-term momentum is improving. Price is trading at $20.27, above MA(7) at $20.24, MA(25) at $18.76, and MA(99) at $18.51. Holding above $20.24 could support another attempt toward $21.30. 📊
📈 4H Chart: Recovery is gaining strength, with price above MA(7) at $18.83 and MA(25) at $18.55, but still above MA(99) at $19.33. The $21.22 area is the next important resistance, while $19.30 is a key level to watch. 🚀
🌍 1D Chart: The daily structure remains highly volatile following the spike toward $24.63. Price is above MA(7) at $18.36 and MA(25) at $19.11, but the negative MACD reading signals that momentum still needs confirmation. ⚠️
🎯 Key Levels: Resistance: $21.30, $23.12 and $24.63. Support: $19.30, $18.55 and $17.50. 🔑
⚡ The Verdict: Buyers are showing renewed strength, but a sustained move above $21.30 would provide a stronger bullish signal. Remember, UVXYB is a leveraged volatility-linked product and can experience sharp price swings and significant losses.
❓Can $UVXYB break $21.30 and make another run toward $24.63, or is a pullback coming? 🌪️
#UVXYB #VolatilityTrading #MarketAnalysis
#HuangReportedlyConsidersReturnToNvidia #AnthropicIPOTestsInvestorAppetiteForAI #BitcoinExtendsLosingStreakToSixWeeks #MUFGSMFGMizuhoPlanYenBackedStablecoin