


Key Highlights
XRP is trading at $0.952 — down 43% from its October high of $1.55, now sitting at ascending trendline support
An analyst identifies a nine-year ascending triangle with the rising trendline at $0.78 as the critical floor
Weekly close above $3.50 and retest as support triggers measured move to $18 per the pattern target
XRP spot ETFs logged 5 consecutive outflow days totaling $19.1M per SoSoValue data
XRP is trading at approximately $0.952, down 1.87% in the past 24 hours and more than 43% from its October high of $1.55 — a drawdown that has brought the asset directly to one of the most consequential technical junctures in its multi-year chart structure. The market cap stands at approximately $60.5 billion, and with $1.48 billion in 24-hour volume, the selling pressure has been orderly rather than panicked. What matters now is where the correction ends.
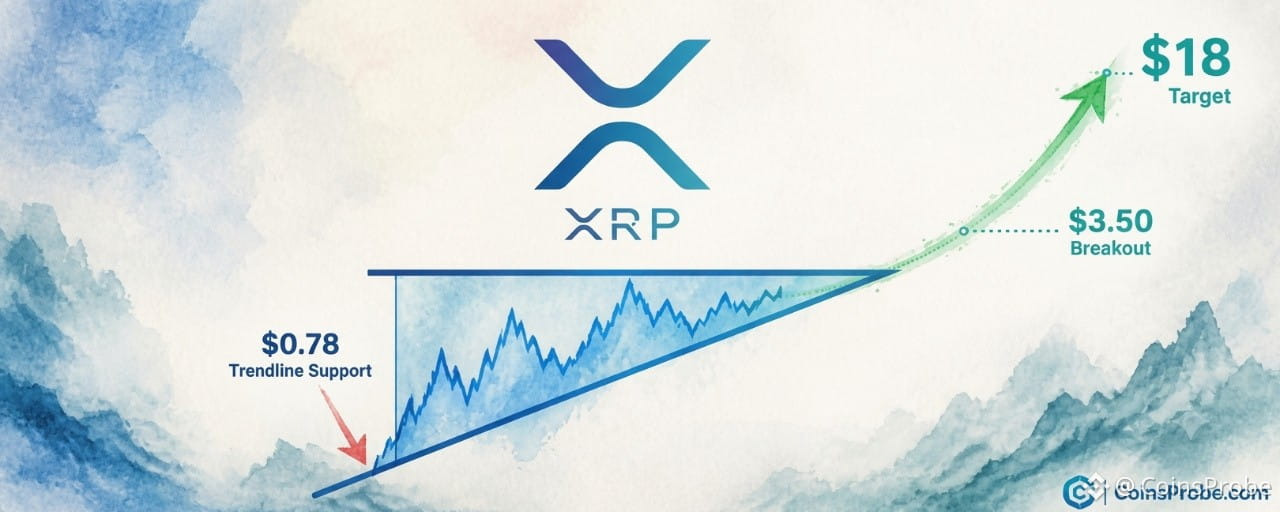
An analyst at @alicharts has flagged a structure that places $0.78 as the critical level — the rising trendline of a multi-year ascending triangle that has been forming on XRP’s weekly chart since 2017. The analyst’s exact words: “XRP COULD BOTTOM AT $0.78 — A big ascending triangle appears to have been developing on XRP’s weekly chart since 2017. With $XRP now down more than 43% from its October high of $1.55, this structure suggests the correction could extend toward the triangle’s rising trendline.” The structure carries three distinct price events embedded within it: a potential bottom at $0.78, a first major resistance at $3.50, and a full measured-move target of $18 on confirmed breakout.
The Structure — A Nine-Year Ascending Triangle
The ascending triangle is one of the most classically reliable continuation patterns in technical analysis. It is defined by two boundaries: a rising diagonal support trendline connecting a sequence of higher lows, and a flat horizontal resistance line marking a ceiling that price has repeatedly tested but not broken. The compression between these two lines represents a tightening of supply and demand — sellers hold firm at a fixed level, buyers step in at progressively higher floors. The eventual resolution, when the structure matures, tends to produce directional moves that are proportional to the height of the triangle.
On XRP’s weekly chart, this structure has been forming since at least 2017, spanning nearly a decade of price action. The ascending trendline connects the major higher lows across multiple cycles — the 2018 bear market low, the 2020 accumulation zone, and subsequent troughs — producing a rising floor that now intersects at approximately $0.78. The horizontal resistance sits at $3.50, a level XRP has approached but not achieved a sustained weekly close above. The chart shared by the analyst shows current price at $0.952 sitting directly at the ascending support trendline — the lower boundary of the triangle — with the speculative projection targeting $9.00–$18.00 in the 2028–2029 timeframe following a confirmed breakout.
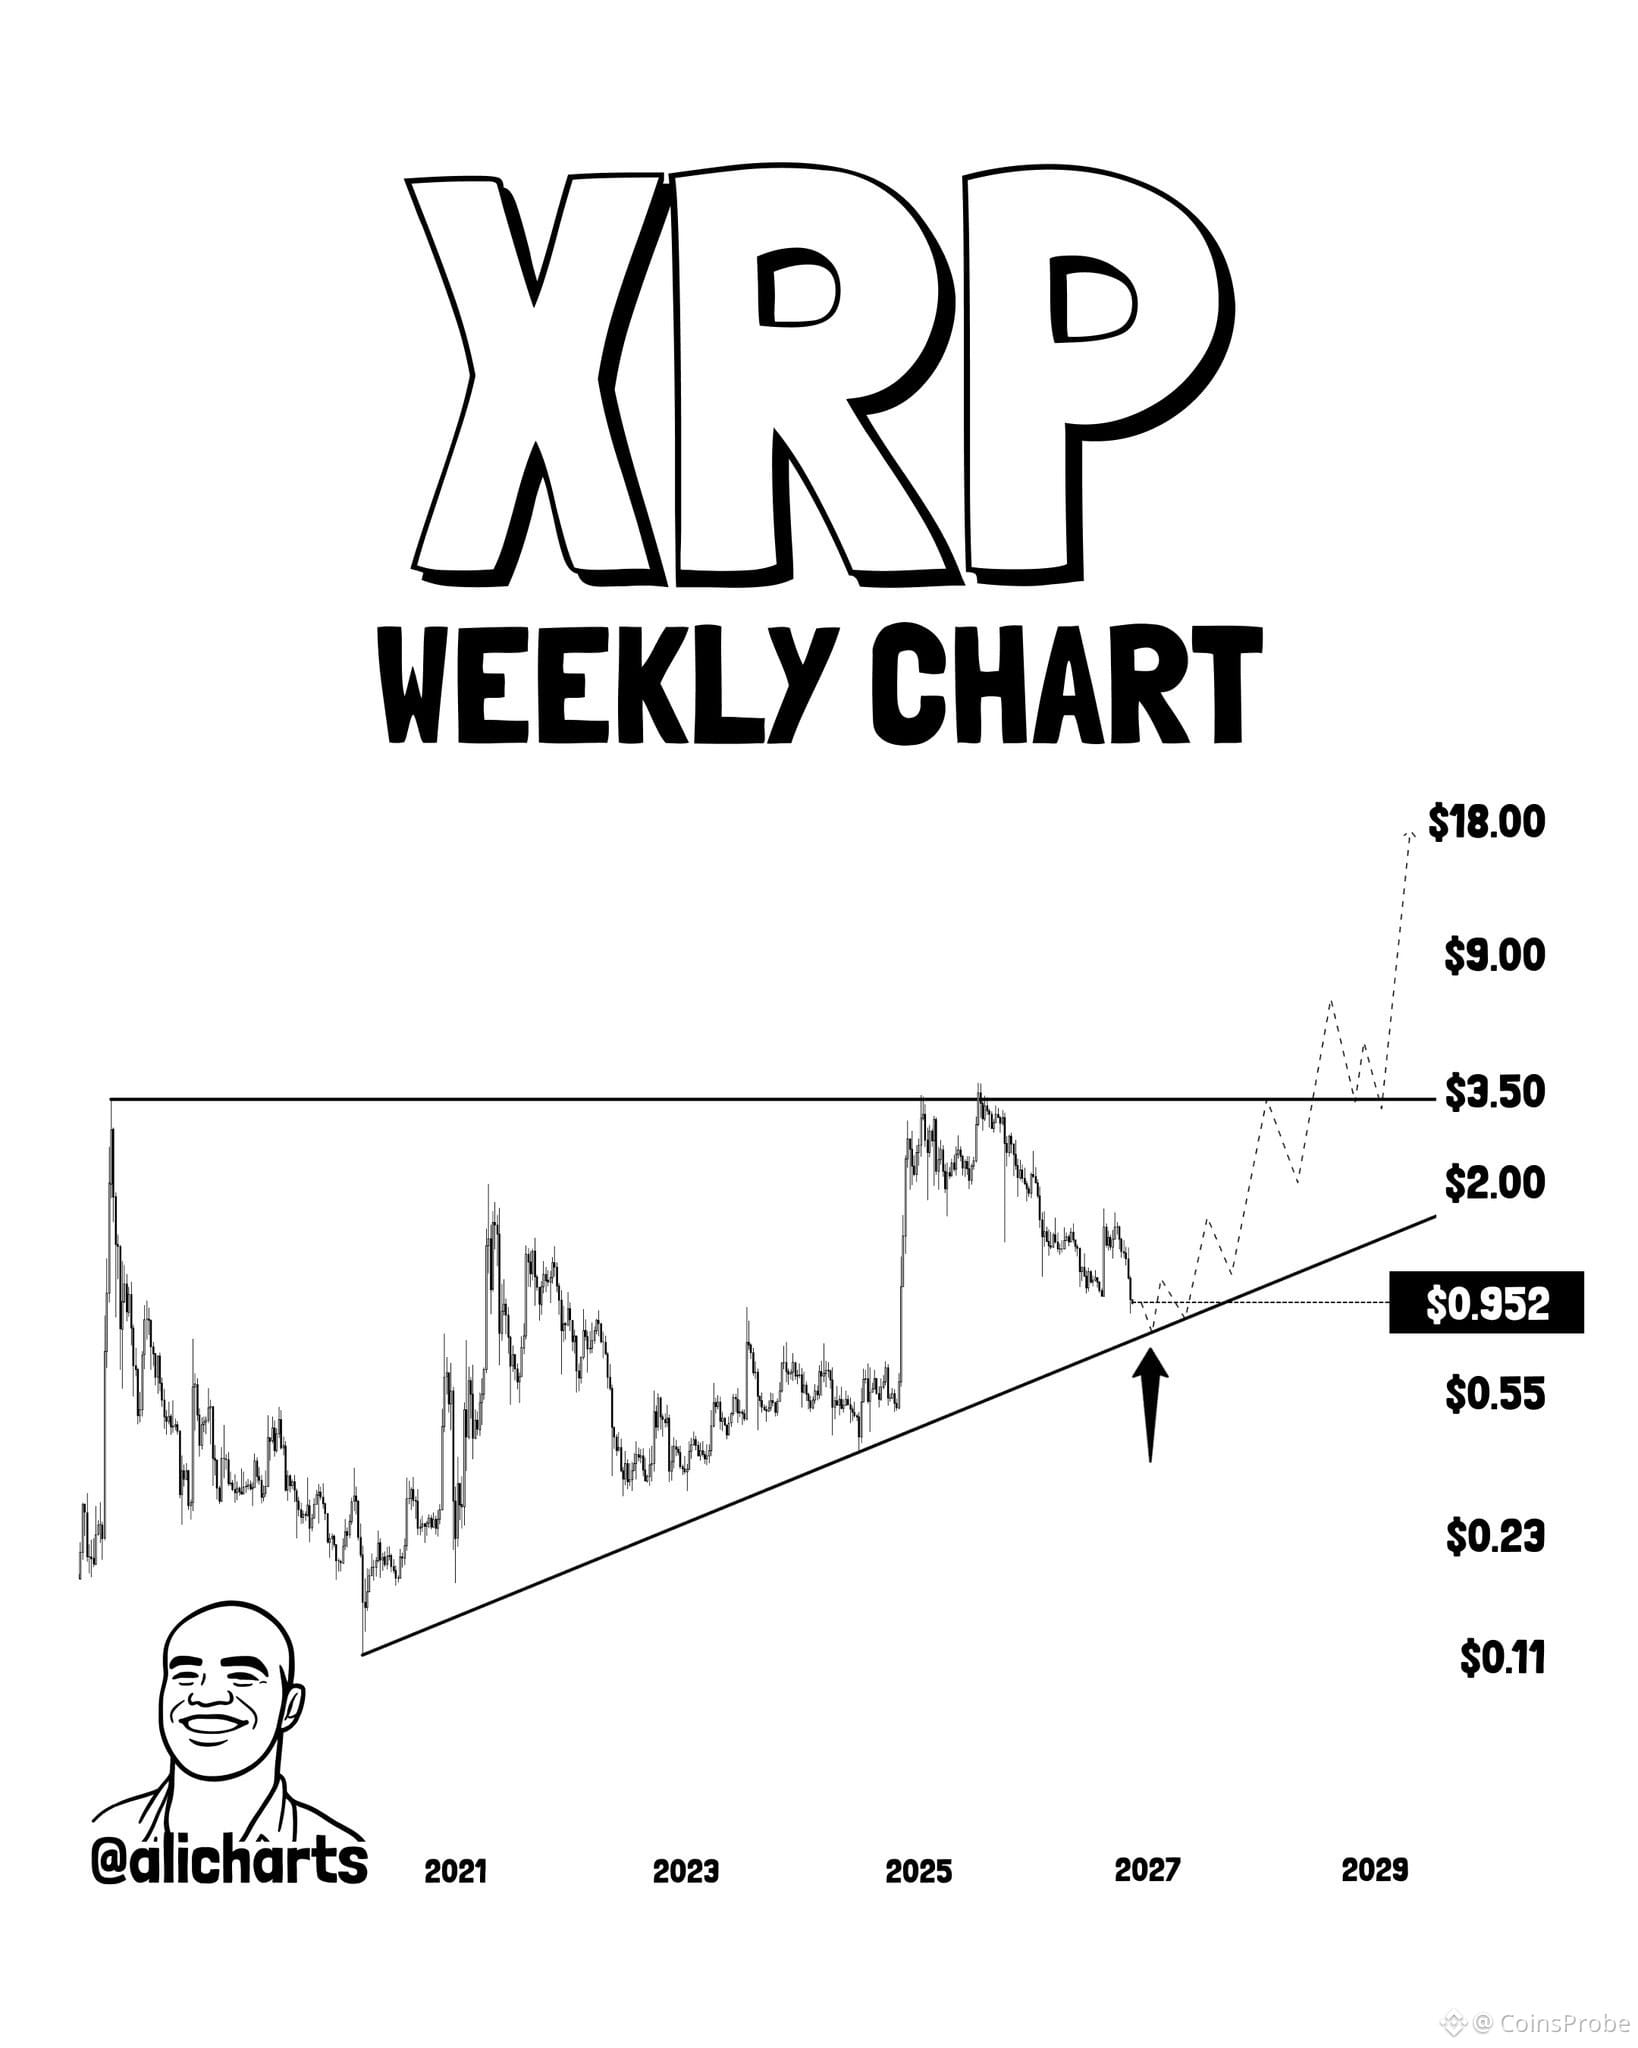
XRP Weekly Chart Analysis | Source: @alicharts (X)
The Three Price Events — $0.78, $3.50, and $18
The analyst’s framework is sequential, not simultaneous. Each level is conditional on the previous one holding or breaking.
$0.78 — The Trendline Floor. This is where the rising support of the ascending triangle currently intersects. The analyst’s thesis is that XRP’s correction, already 43% deep from $1.55, may extend further toward this level before buyers absorb the selling. At $0.78, the structural argument is that the ascending trendline — nine years in construction — becomes the defensive line. A hold at this level would constitute the pattern’s higher low and preserve the entire structure.
$3.50 — The Horizontal Resistance. This is the flat ceiling of the ascending triangle. It has acted as supply on multiple prior approaches. A weekly close above $3.50, followed by a retest of that level as support, is the specific confirmation event the analyst identifies as triggering the full measured move. This is not a breakout on the first touch — the analyst explicitly requires the retest as support before the larger target is active.
$18 — The Measured-Move Target. On confirmed breakout and retest of $3.50, the analyst projects a move to $18. This target is derived from the height of the ascending triangle applied to the breakout point — a standard measured-move calculation for this pattern type. The chart’s speculative projection traces this trajectory toward the 2028–2029 timeframe. Intermediate levels cited on the chart include $9.00 as a waypoint before $18.
ETF Context — Five Consecutive Outflow Days
The technical picture exists against a backdrop of institutional softness. XRP spot ETF data via SoSoValue shows a daily net outflow of $1.1 million on the latest trading date (November 13), extending a streak of five consecutive outflow days totaling $19.1 million. Total ETF net assets stand at $1.15 billion, with cumulative net inflows since launch at $1.79 billion. The five-day outflow trend does not invalidate the structural thesis — it contextualizes the near-term selling pressure that has driven XRP toward the ascending trendline in the first place. If that trendline holds at $0.78, ETF flow data will be one of the first indicators to show a reversal in institutional positioning.
The broader macro calendar adds another layer of near-term uncertainty. Core PCE Price Index data and GDP (QoQ) are due November 24, alongside S&P Global Services and Manufacturing PMI readings on November 22. These events have historically amplified volatility in risk assets including crypto. Traders monitoring $0.78 as a potential entry zone will want to account for the possibility that macro data accelerates the move before structural support is tested.
It is also worth noting that XRP’s current drawdown is not an isolated event. Bitcoin has also faced structural pressure in recent sessions, and broad crypto market weakness has amplified the correction across majors. The ascending triangle thesis, however, is XRP-specific and independent of Bitcoin’s near-term positioning.
What the Pattern Says — And What It Doesn’t
The ascending triangle on XRP’s weekly chart is a structure built over nine years. That longevity is both its strength and its limitation. The longer a pattern forms, the more significant the eventual resolution — but it also means timing is imprecise. The analyst’s $0.78 trendline level is not a guaranteed bounce zone. It is the structural support where the pattern’s validity will be tested.
What the pattern does say: XRP is trading at the lower boundary of a multi-year constructive structure. If that boundary holds, the technical setup calls for a recovery toward $3.50 — and on a confirmed weekly close plus retest above $3.50, a measured move toward $18 becomes the primary target.
What the pattern doesn’t say: It does not guarantee a bounce at $0.78. A weekly close below the ascending trendline — particularly a sustained close, not an intraday wick — would invalidate the structure and remove the $18 target from the table. The pattern also does not specify when the $3.50 breakout occurs. The projected 2028–2029 timeframe on the chart is speculative, not a fixed date.
What to watch: A weekly close at or above $0.78 with a subsequent recovery in volume would be the first confirmation that the trendline is holding. Failure to hold — a weekly close below $0.78 — would be the structural invalidation signal.
Bullish Scenario — Hold at $0.78
XRP finds support at the ascending trendline near $0.78, prints a weekly close above that level, and begins recovery. First target is $3.50. On a confirmed weekly close above $3.50 and retest as support, the measured move to $18 activates — consistent with the multi-year triangle’s projected resolution in the 2028–2029 window.
Bearish Scenario — Loss of $0.78
A sustained weekly close below $0.78 breaks the ascending trendline that has defined the structure since 2017. This invalidates the ascending triangle thesis entirely and removes the $3.50 and $18 targets from consideration. The next structural reference on the weekly chart below that level would require a full reassessment.
XRP is at $0.952 — 43% off its October high, trading on the ascending trendline of a nine-year pattern. The analyst’s framework is clear: $0.78 is the trendline. Hold it, and $3.50 becomes the next test. Weekly close above $3.50 with a retest as support unlocks $18. Lose it, and the structure built since 2017 is gone. Everything in this setup resolves at $0.78 — that is the number traders are watching.
Disclaimer: The views and analysis presented in this article are for informational purposes only and reflect the author’s perspective, not financial advice. Technical patterns and indicators discussed are subject to market volatility and may or may not yield the anticipated results. Investors are advised to exercise caution, conduct independent research, and make decisions aligned with their individual risk tolerance.