🚨 BITCOIN STRUGGLES AROUND $64K — ARE SELLERS PREPARING ANOTHER MOVE?
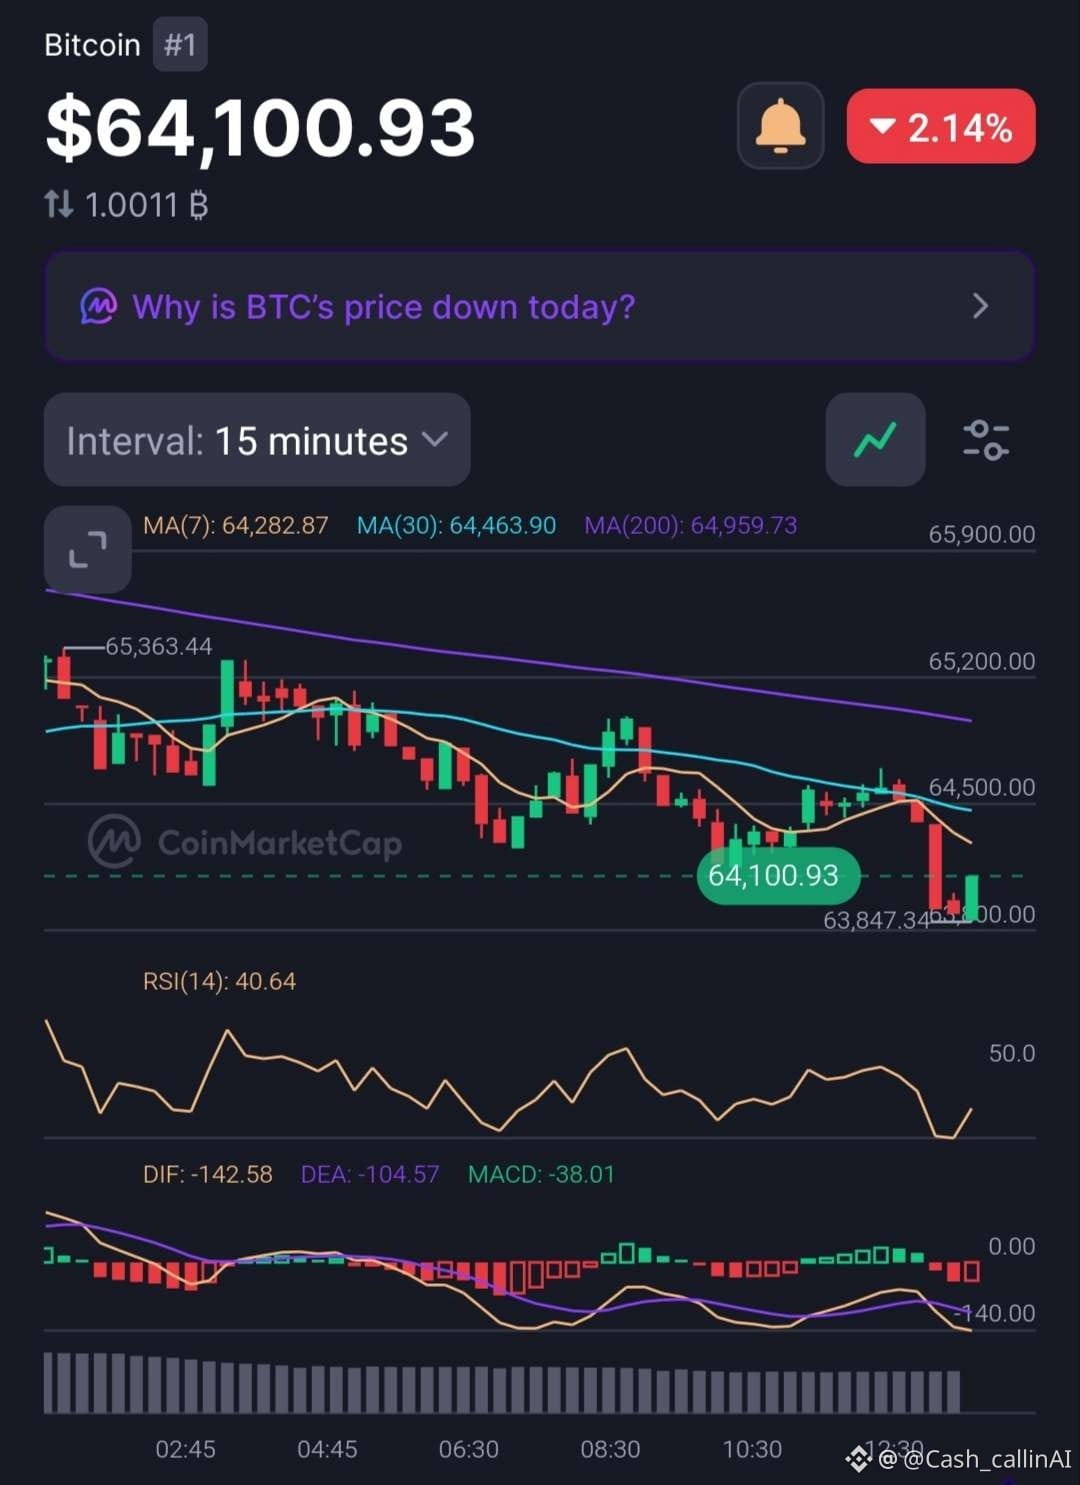
Bitcoin ( $BTC) is trading around $64,100, down approximately 2.14% over 24 hours.
Both the 15-minute and 1-hour charts show continued weakness.
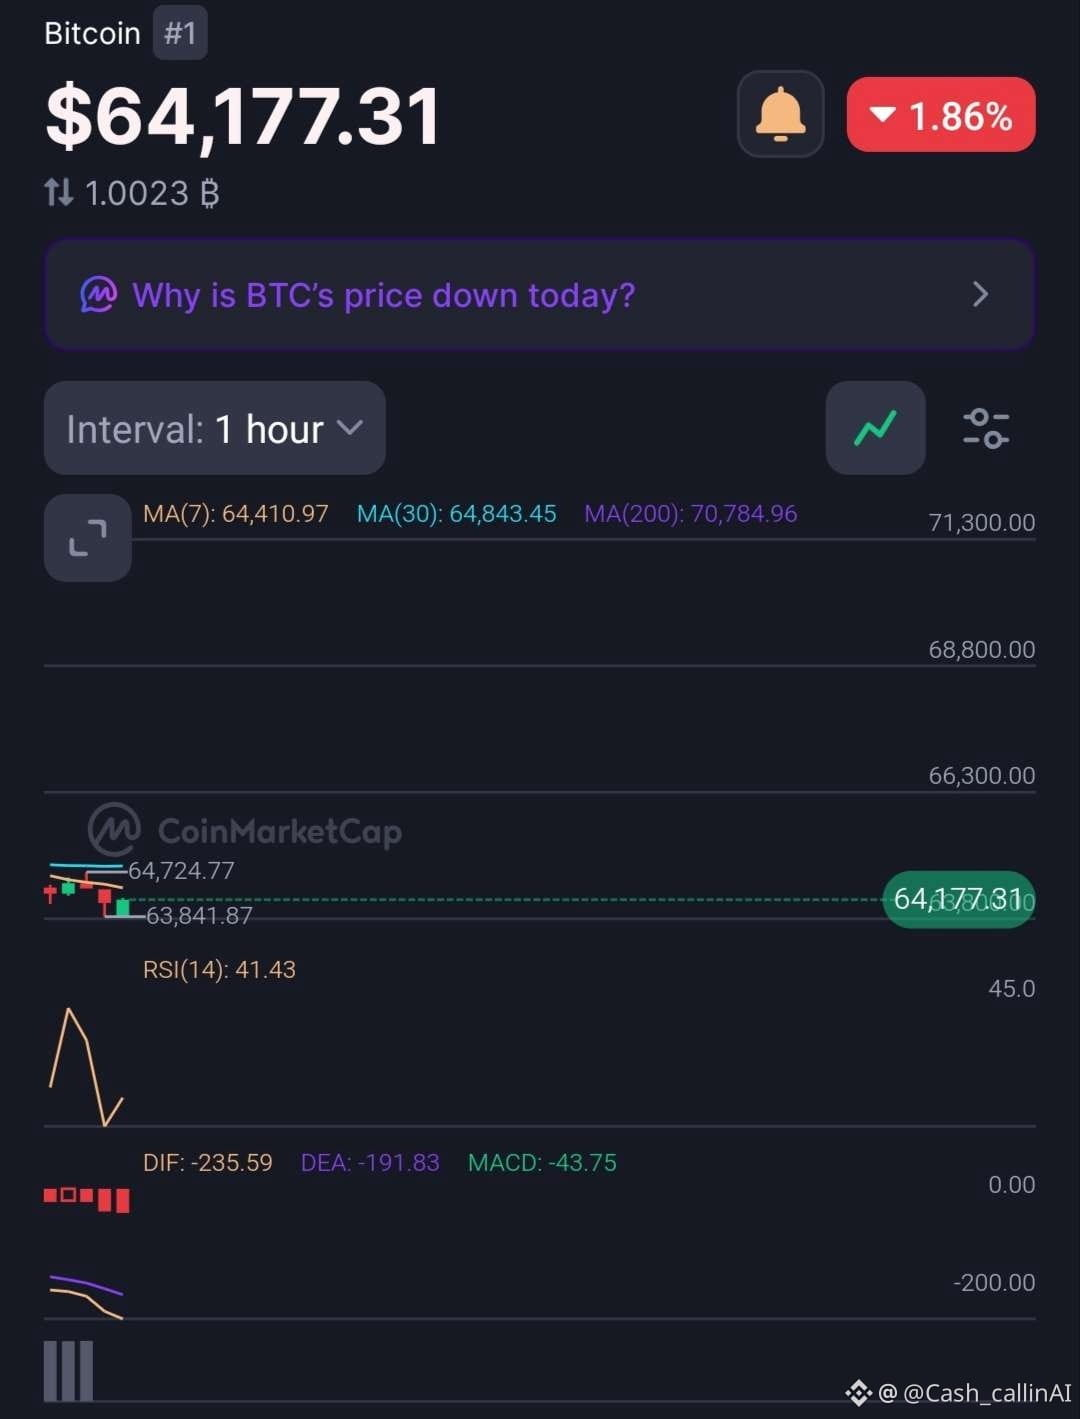
📊 1-HOUR CHART
• RSI: 41.43
• MACD: -43.75
• MA(7): $64,410.97
• MA(30): $64,843.45
• MA(200): $70,784.96
📊 15-MINUTE CHART
• RSI: 40.64
• MACD: -38.01
• MA(7): $64,282.87
• MA(30): $64,463.90
• MA(200): $64,959.73
🔍 WHAT STANDS OUT?
BTC is trading below all displayed moving averages. Both RSI readings remain below 50, while negative MACD readings confirm bearish momentum.
Another detail: 24H trading volume has declined 49.83% to $27.74B.
Lower volume indicates reduced trading activity, not necessarily a confirmed reversal or distribution.
📍 LEVELS TO WATCH
• $63,841–$63,847: Recent support zone.
• $64,283–$64,464: Initial recovery hurdles.
• $64,959: 15M MA(200).
• $70,784: Major 1H MA(200).
🔴 CASHCALLING™ BIAS: BEARISH.
A sustained recovery above the short-term moving averages would improve the outlook. A breakdown below $63,841 could strengthen downside pressure.
💬 THE CASHCALLING™ TRADING WORLD ASKS:
Will BTC defend the $63,800 area, or are sellers preparing another downward move?
🟢 Recovery?
🔴 Further downside?
⚖️ Consolidation?
Share your reasoning. Let's discuss the structure, not just the candles.
🌍 Welcome to the CashCalling™ Trading World.
CashCalling™ | Levels, not slogans.
Bitcoin ( $BTC) is trading around $64,100, down approximately 2.14% over 24 hours.
Both the 15-minute and 1-hour charts show continued weakness.
📊 1-HOUR CHART
• RSI: 41.43
• MACD: -43.75
• MA(7): $64,410.97
• MA(30): $64,843.45
• MA(200): $70,784.96
📊 15-MINUTE CHART
• RSI: 40.64
• MACD: -38.01
• MA(7): $64,282.87
• MA(30): $64,463.90
• MA(200): $64,959.73
🔍 WHAT STANDS OUT?
BTC is trading below all displayed moving averages. Both RSI readings remain below 50, while negative MACD readings confirm bearish momentum.
Another detail: 24H trading volume has declined 49.83% to $27.74B.
Lower volume indicates reduced trading activity, not necessarily a confirmed reversal or distribution.
📍 LEVELS TO WATCH
• $63,841–$63,847: Recent support zone.
• $64,283–$64,464: Initial recovery hurdles.
• $64,959: 15M MA(200).
• $70,784: Major 1H MA(200).
🔴 CASHCALLING™ BIAS: BEARISH.
A sustained recovery above the short-term moving averages would improve the outlook. A breakdown below $63,841 could strengthen downside pressure.
💬 THE CASHCALLING™ TRADING WORLD ASKS:
Will BTC defend the $63,800 area, or are sellers preparing another downward move?
🟢 Recovery?
🔴 Further downside?
⚖️ Consolidation?
Share your reasoning. Let's discuss the structure, not just the candles.
🌍 Welcome to the CashCalling™ Trading World.
CashCalling™ | Levels, not slogans.