

1. Market structure
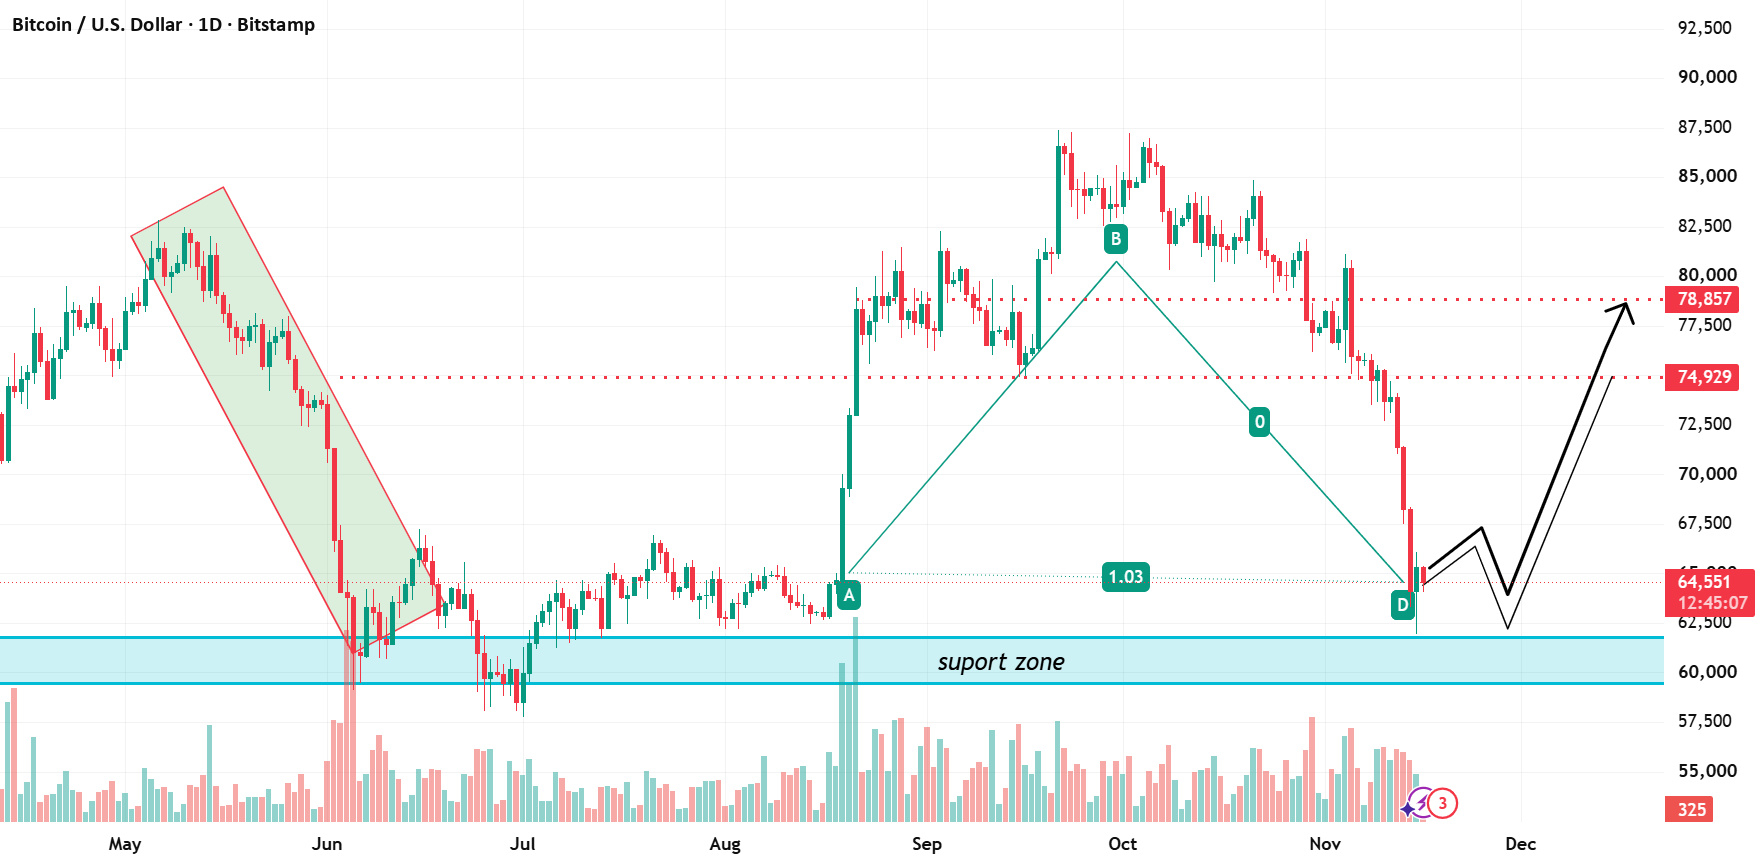
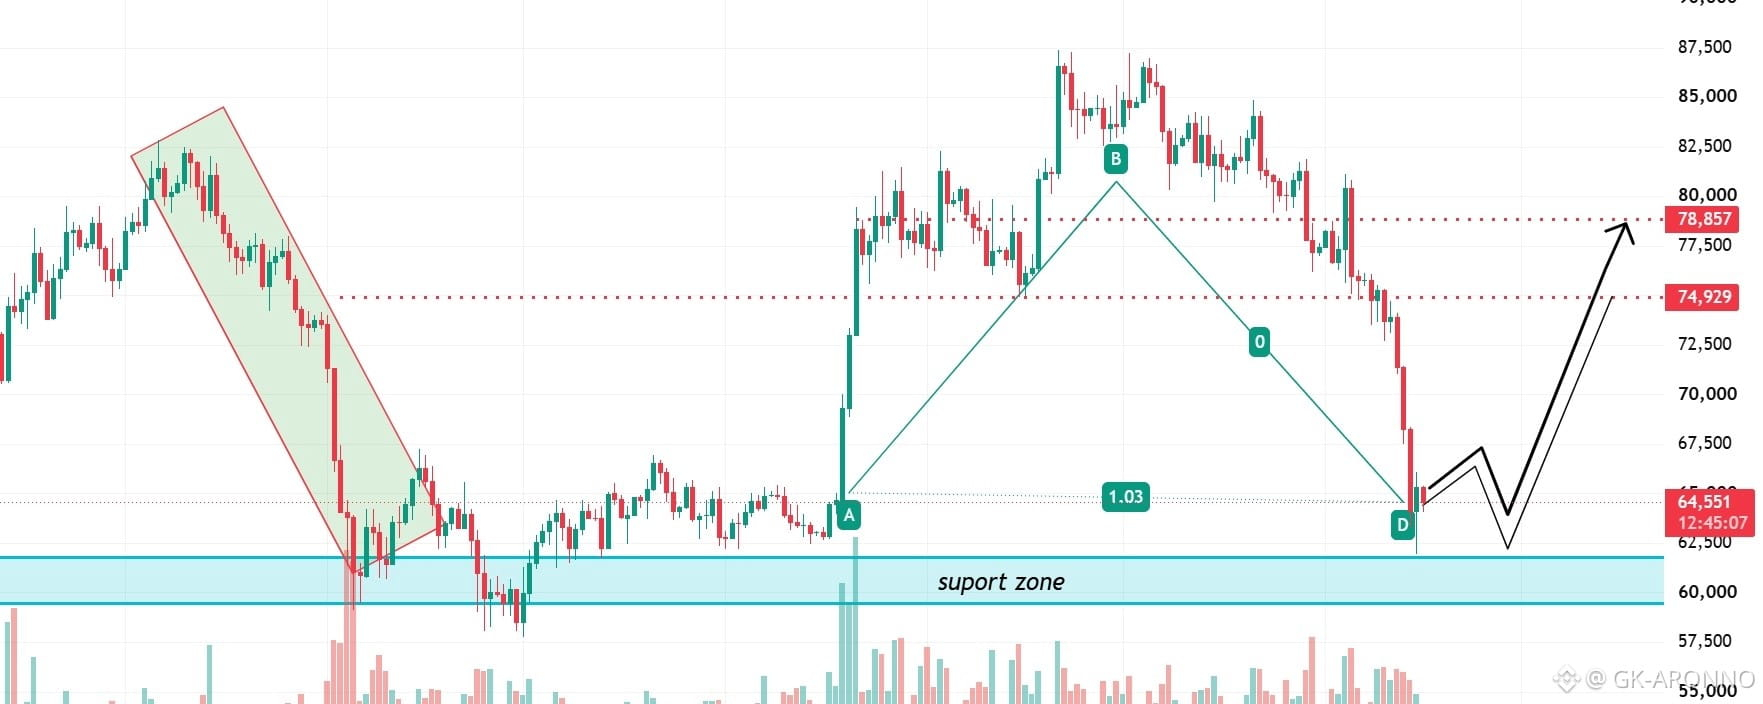
The BTC/USD daily chart shows a significant decline from the $87,000 region toward the $64,000 area.
Bitcoin has formed lower highs and lower lows, indicating short-term bearish market structure.
Price has experienced strong selling pressure around $80,000–$85,000.
The recent sharp sell-off has brought BTC into an important historical support zone.
The current price shown is approximately $64,549.
2. Important support zone
Major support: $59,500–$61,500
The blue highlighted area represents the key demand/support zone.
Potential reasons for its importance:
Previous price consolidation.
Historical buying interest.
Potential demand from buyers looking for discounted prices.
If this zone holds, Bitcoin could develop a bullish reversal.
However, a daily close below $59,500 would weaken the bullish scenario and could signal further downside.
3. Key resistance levels
Resistance
Price
Resistance 1
$65,500–$67,500
Resistance 2
$74,929
Resistance 3
$78,857
Major resistance
$82,000–$85,000
The $74,929 and $78,857 levels are particularly important because they are marked on the chart.
4. Potential bullish scenario
The black projected arrows illustrate a possible recovery pattern:
BTC attempts to stabilize around $64,000–$65,000.
Price potentially retraces toward $62,000–$61,000.
Buyers defend the support zone.
BTC rebounds toward $67,500.
A breakout could open the way toward $74,929 and eventually $78,857.
Bullish confirmation
A daily close above $67,500, followed by a successful retest, would provide an early indication of improving momentum.
5. Bearish scenario
The bullish projection is not guaranteed.
Failure to hold $62,000 could lead to another test of the blue support zone.
A decisive daily close below $59,500 could invalidate the support-based reversal idea.
Continued lower highs would keep the broader short-term structure bearish.
6. Trading strategy considerations
Setup
Confirmation
Aggressive long
Bullish rejection around $61K–$62K
Safer long
Daily reclaim of $67.5K
Breakout target
$74,929
Extended target
$78,857
Invalidation
Daily close below $59.5K
These are conditional scenarios, not confirmed trading signals.
Final conclusion
Bitcoin is approaching a critical technical decision area. The $59,500–$61,500 support zone could become the foundation for a recovery, but buyers need to demonstrate strength before a bullish reversal can be confirmed.
My view: Watch for a liquidity sweep below $64,000, a bullish reaction, and a recovery above $67,500. If these conditions develop, the chart's projected move toward $74,929 and $78,857 becomes more plausible.