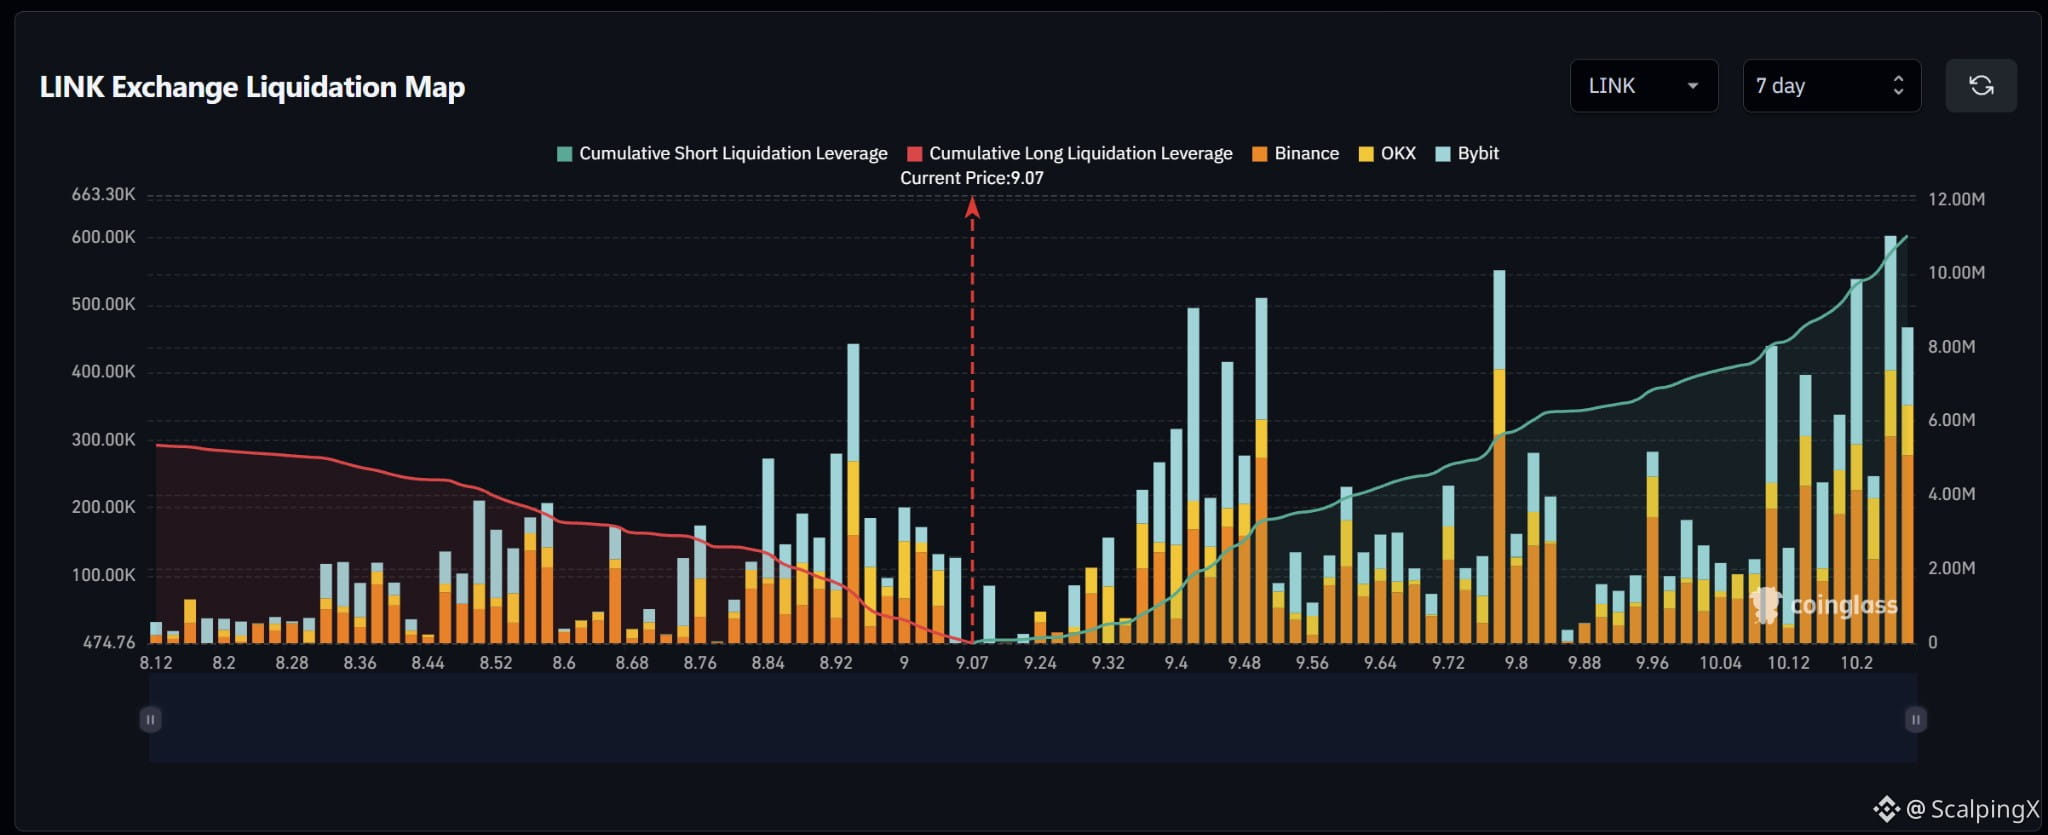
$LINK – Liquidation Map (7 days) – Index ~9.07
🧭 The preferred scenario is a nearby long-liquidation sweep at 9.00–9.05. Estimated cumulative short exposure is larger, but dense short clusters sit farther away at 9.36–9.50 and 9.78–9.84.
🔻 Losing 9.00 without a reclaim would shift focus to 8.92–8.96, particularly around 8.94. Holding below 8.92 would bring 8.84–8.90 into focus, followed by 8.74–8.80.
🎯 A long-liquidation sweep followed by a quick reclaim of 9.07 would weaken bearish continuation. Above, exposure across 9.12–9.26 is sparse before larger short-liquidation bars appear at 9.28–9.34.
⚖️ A break and hold above 9.34 would shift preference toward short sweeps at 9.36–9.50, particularly around 9.42 and 9.50.
Continuation above 9.50 would bring 9.60–9.72 and then 9.78–9.84 into view; farther out, 10.10–10.25 contains several large bars.
#LiquidationMap
🧭 The preferred scenario is a nearby long-liquidation sweep at 9.00–9.05. Estimated cumulative short exposure is larger, but dense short clusters sit farther away at 9.36–9.50 and 9.78–9.84.
🔻 Losing 9.00 without a reclaim would shift focus to 8.92–8.96, particularly around 8.94. Holding below 8.92 would bring 8.84–8.90 into focus, followed by 8.74–8.80.
🎯 A long-liquidation sweep followed by a quick reclaim of 9.07 would weaken bearish continuation. Above, exposure across 9.12–9.26 is sparse before larger short-liquidation bars appear at 9.28–9.34.
⚖️ A break and hold above 9.34 would shift preference toward short sweeps at 9.36–9.50, particularly around 9.42 and 9.50.
Continuation above 9.50 would bring 9.60–9.72 and then 9.78–9.84 into view; farther out, 10.10–10.25 contains several large bars.
#LiquidationMap