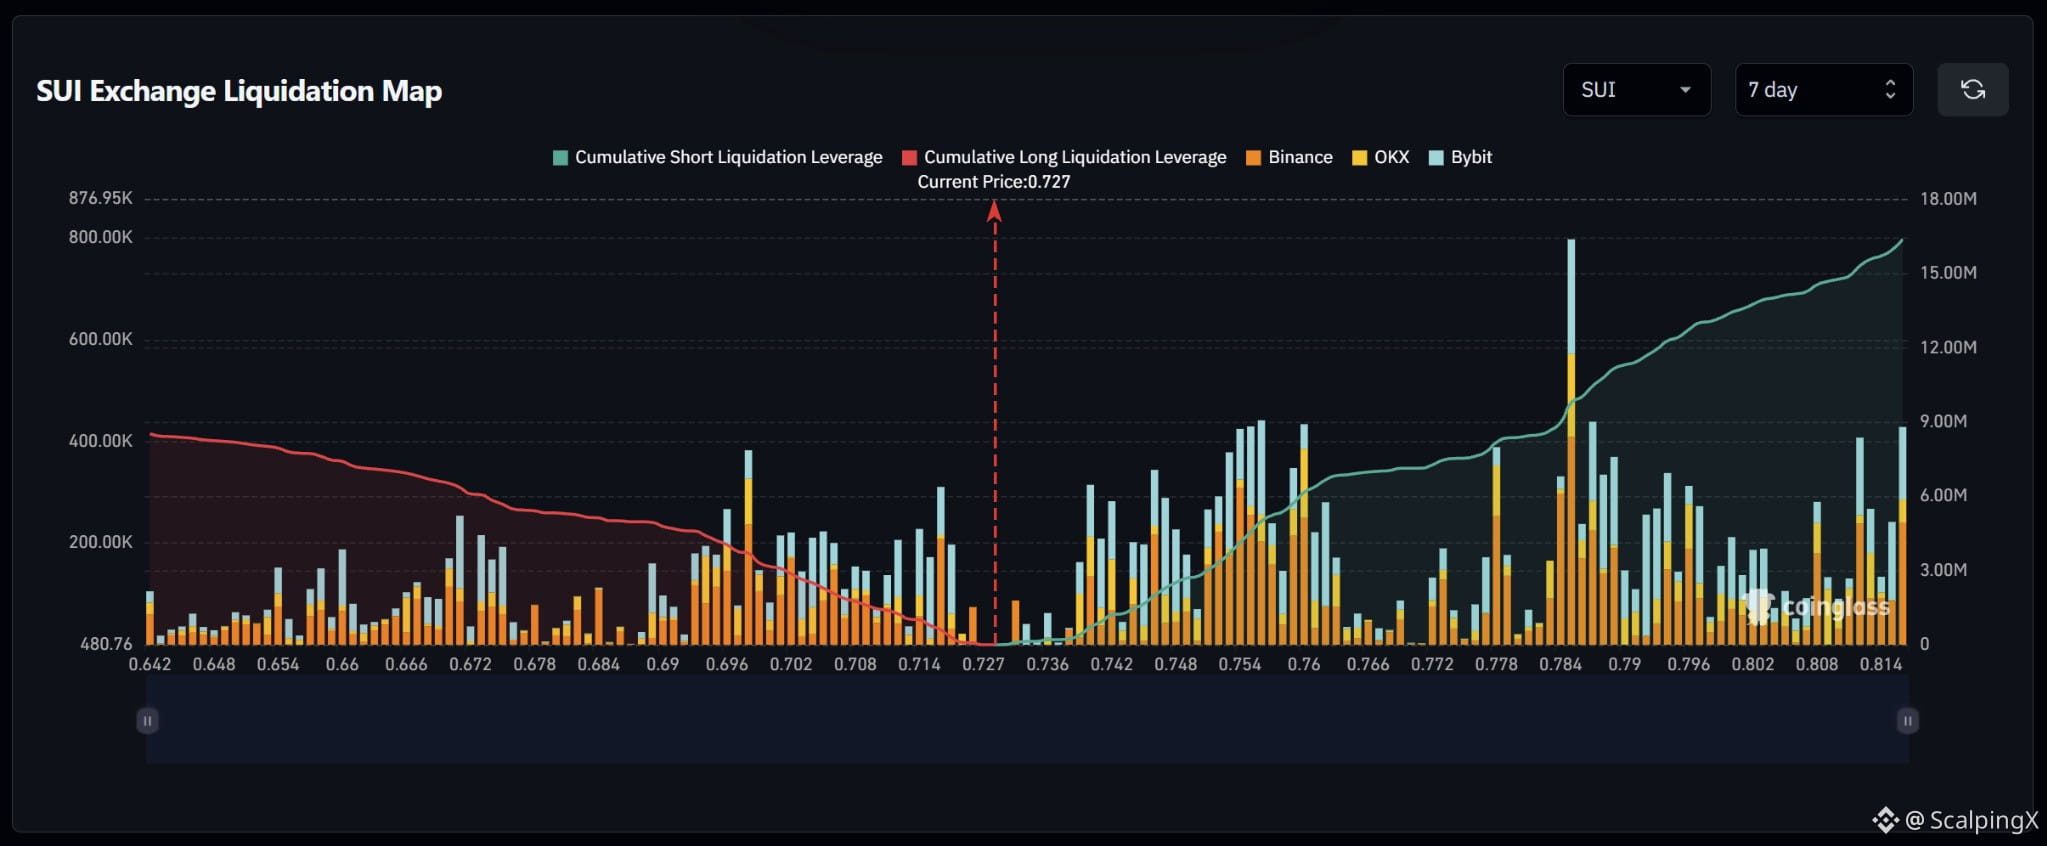
$SUI – Liquidation Map (7 days) – Index ~0.727
🧭 The preferred scenario is a long-liquidation sweep at 0.714–0.720, where substantial potential liquidation bars sit near price. Estimated cumulative short exposure is larger, but dense clusters become more evident from 0.739 upward.
🔻 Losing 0.720 without a reclaim would shift focus to 0.714–0.719. Holding below 0.714 after the sweep would bring 0.700–0.710 into focus, followed by 0.694–0.698, particularly around 0.697.
🎯 A long-liquidation sweep followed by a quick reclaim of 0.727 would weaken bearish continuation. A break and hold above 0.736 would shift preference toward short sweeps at 0.739–0.748, then the denser 0.751–0.761 band.
⚖️ Holding above 0.761 would bring 0.778–0.790 into view, with the map’s largest bar near 0.785. Exposure across 0.765–0.770 is sparse; a short sweep followed by a drop below 0.736 would weaken bullish continuation.
#LiquidationMap
🧭 The preferred scenario is a long-liquidation sweep at 0.714–0.720, where substantial potential liquidation bars sit near price. Estimated cumulative short exposure is larger, but dense clusters become more evident from 0.739 upward.
🔻 Losing 0.720 without a reclaim would shift focus to 0.714–0.719. Holding below 0.714 after the sweep would bring 0.700–0.710 into focus, followed by 0.694–0.698, particularly around 0.697.
🎯 A long-liquidation sweep followed by a quick reclaim of 0.727 would weaken bearish continuation. A break and hold above 0.736 would shift preference toward short sweeps at 0.739–0.748, then the denser 0.751–0.761 band.
⚖️ Holding above 0.761 would bring 0.778–0.790 into view, with the map’s largest bar near 0.785. Exposure across 0.765–0.770 is sparse; a short sweep followed by a drop below 0.736 would weaken bullish continuation.
#LiquidationMap