
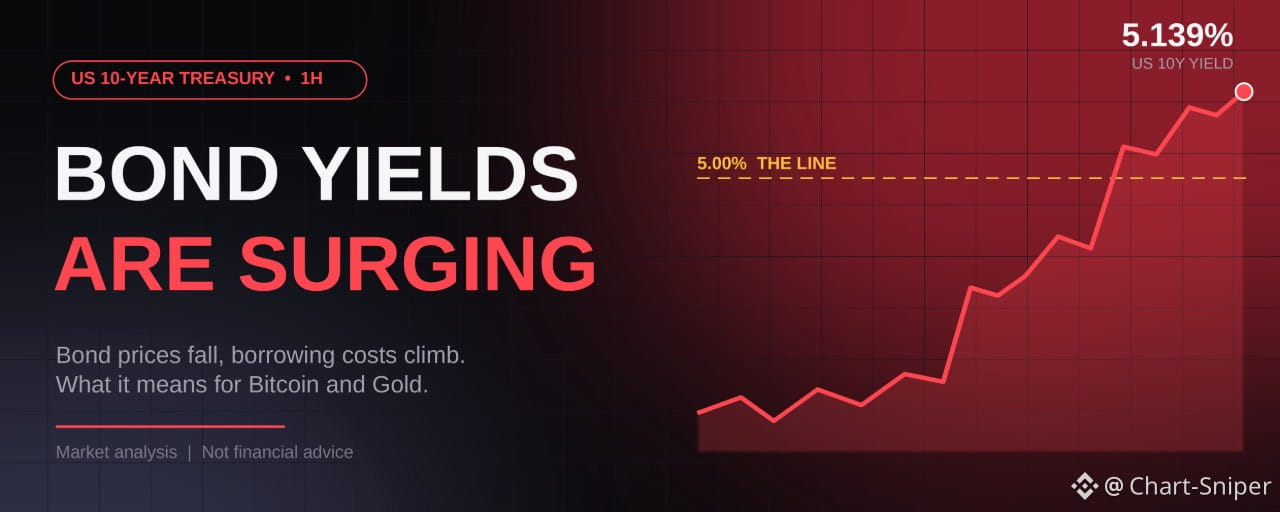

When people say “bonds are going and going,” they usually mean one thing: yields are rising. The US 10-Year Treasury yield is now at 5.139% on the 1H chart. That is above the 5% level that grabbed headlines earlier this autumn. Here is what is happening and why crypto traders should care.
📘 Quick refresher: yields vs. bond prices
Bond prices and yields move in opposite directions. When the yield rises, existing bond prices fall. A steady climb in yields means bond holders are being sold down and investors are demanding more return to lend to the US government.
🔍 What the chart is showing
Trend change: The yield spent early November in a downtrend, with lower highs and a low near 4.81%. Around 9–10 Nov it broke above the descending trendline.
Impulsive breakout: The break was followed by two sharp upward legs, first to about 5.01% and then through 5.076%, which was the key level on the chart.
Higher high: Price printed a higher high near 5.17% and is now moving in a rising channel, sitting close to the channel’s lower edge around 5.13%–5.14%.
Fibonacci: The advance started from the 38.2%–61.8% zone of the earlier range near 4.89%, and price has since run far above the 100% level at about 4.97%.
Key levels: 5.076% is now support. Below it sit 4.97%, 4.81% and the red line at 4.743%. Above, the channel top points toward roughly 5.20%–5.25%.
Bias: bullish for yields while they hold above 5.076% and inside the channel.
🌍 The backdrop
This move did not come out of nowhere. The 10-year yield crossed 5% on 14 Sept 2026, intensifying concerns about borrowing costs. Coverage from that period pointed to an oil surge and a Fed rate hike alongside inflation worries as drivers. Later, markets were pricing about a 76% chance of a 25bp hike in December as of late October. A hawkish Fed plus heavy government borrowing is a classic recipe for higher long-term yields.
⚠️ Why this matters for Bitcoin, Gold and risk assets
1. Higher discount rates hit risk assets. When “safe” Treasuries pay over 5%, investors need a bigger reward to hold volatile assets like BTC and ETH. Money can rotate out of risk and into bonds.
2. A stronger dollar tends to follow. Rising US yields often support the dollar, which is usually a headwind for Bitcoin and gold.
3. Gold has no yield. Gold pays nothing, so it competes poorly with 5% risk-free returns. That fits the recent slide in gold from the $4,145 area to about $3,884.
4. Leverage gets expensive. Higher rates tighten financial conditions and make leveraged speculation less attractive, which lines up with the heavy liquidations and ETF outflows we have seen in crypto.
None of this is a guarantee. Yields are one driver among many, and correlations can break down. But when yields trend up strongly, rallies in BTC and gold have often struggled.
🎯 What to watch next
If yields keep rising
A hold above 5.076% and a push toward 5.20%–5.25% would keep pressure on BTC and gold.
In that case, watch BTC’s key levels: resistance at $66,428, support at $62,460, then $57,520.
If yields roll over
A break below the channel and 5.076% would signal the bond sell-off is pausing, with 4.97% next.
That would typically ease pressure on risk assets and give BTC room to retest $66,428 and above.
🛡️ Practical tips
Treat the 10Y yield as a macro filter, not an entry signal. Pair it with price structure on your own charts.
Be careful around data and Fed headlines, when yields and crypto can both move sharply.
Keep leverage low and always use a stop-loss.
The chart was captured on a Sunday, so expect possible gaps when markets open.
⚠️ This post is for educational and informational purposes only and is not financial advice. Trading carries a high risk of loss. Always do your own research before making any decision.
@Binance Square Official #CryptoSelloffTriggersMultipleWhaleLiquidations #USSpotXRPETFsSeeLargestWeeklyOutflowIn8Months #WillFOMCMinutesReinforceRateHikeExpectations? #Binance #ChartSniper