


BTC/USD · 1H Chart · Analysis dated 15 Nov 2026
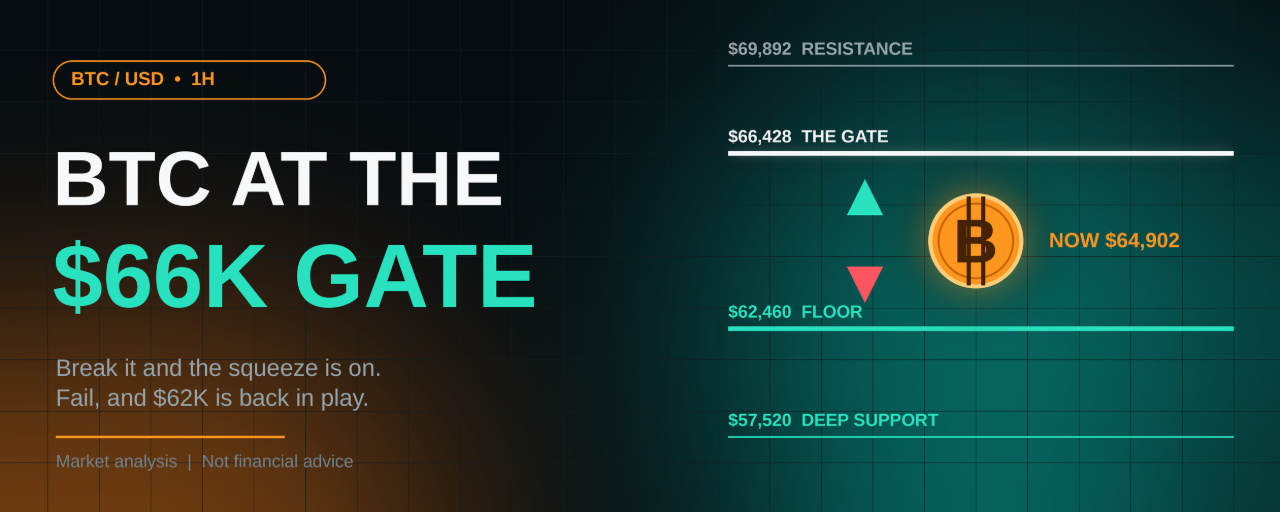
Bitcoin has just done something it hadn’t managed all week: it broke its descending trendline. The 1H chart shows price at $64,901, sitting between a freshly defended floor at $62.4K and a major resistance “gate” at $66,428. The chart’s own note says it plainly: a rejection can send BTC below $60K, while a continued bullish trend could be “massive.”
The backdrop helps explain why the stakes are high. BTC was around $80,200 on 5 Nov, and had slipped to about $74,260 by 10 Nov. That makes today’s $64.9K a drop of roughly 19% in ten days. Sentiment has been heavy too: negative funding rates and weakening spot demand were flagged on 13 Nov as signs of growing bearish positioning. Negative funding also means shorts are crowded, which is exactly the fuel a squeeze needs.
What the chart is showing
Structure. The sequence reads LH → LL → HL → LH. The important piece is the HL at $62,460, a higher low printed after the flush, followed by a sharp green impulse. Buyers stepped in at that level.
Trendline break. The long white descending line that capped every rally since the $74K area was broken to the upside and is now being retested from above. Holding above it is the bulls’ first requirement.
The gate. $66,428 lines up with the 38.2% Fibonacci level and the most recent lower high (the second LH label). Until price closes above it, the lower-high structure is technically intact.
Fibonacci. From the swing high near $73.9K down to the $62.4K low, the retracement levels sit at roughly:
38.2% ≈ $66,400
50% ≈ $67,800
61.8% ≈ $69,200
These are approximations read from the image, so verify them on your own chart.
FVGs. Small bullish FVGs sit just under price (about $64K–$65K) as a cushion, while a bearish FVG cluster overhead sits between roughly $66K and $70K.
Levels on the chart:
Resistance: $66,428 → $69,892 → $72,944 → $77,106 → $80,018 → $81,583
Support: $62,460 → $57,520
Bias: neutral to cautiously bullish above $64K, with a decision at $66,428. The structure only turns bullish on a confirmed close above the gate.
Scenario A: Breakout long (bullish)
Entry: Buy on a 1H close above $66,428, ideally on a retest of $66,200–$66,500 that holds.
Stop-loss: $65,200, back inside the range.
Take profit 1: $67,800 (50% fib)
Take profit 2: $69,892
Take profit 3: $72,944
From an entry near $66,500, risk is about $1,300 against about $3,400 to TP2 (roughly 2.6R) and about $6,400 to TP3 (roughly 4.9R). Consider trailing the stop to breakeven once TP1 fills.
Scenario B: Rejection short (bearish)
Entry: Short if BTC wicks into $65,900–$66,400 and a 1H candle closes back below it.
Stop-loss: $66,800
Take profit 1: $64,000
Take profit 2: $62,460
Take profit 3: $60,000
Breakdown alternative: A 1H close below $62,460 invalidates the higher low. Short on the close or on a retest from below, with a stop at $63,400. Targets are $60,000 and then $57,520, which matches the chart’s “below 60” scenario. From a $62,300 entry, the move to $57,520 is roughly 5R against that stop.
Scenario C: Spot accumulation
For longer-term buyers, the $57.5K–$60K region is the chart’s deeper support zone. Scaling in gradually, with a defined invalidation below it, is easier to manage than trying to catch the exact bottom.
Risk management
Risk 1–2% of your account per trade.
Use stop-losses. This is a Sunday-evening chart, so liquidity is thin and moves around the weekly open can be sharp.
Keep leverage low on Binance Futures. With negative funding, short squeezes can be violent, and failed breakouts can liquidate longs just as fast.
Wait for a candle close beyond a level. A wick is not a break.
Re-check the live chart before acting.
Key levels at a glance
Resistance: $66,428 (gate), $67,800, $69,200 and $69,892, $72,944
Current price: about $64,900
Support: $62,460, then $57,520
⚠️ Disclaimer: This article is for educational and informational purposes only and is not financial advice. Cryptocurrency trading carries a high level of risk, including the loss of your entire capital. The levels above are technical scenarios, not guarantees or recommendations. Do your own research and consult a licensed financial advisor before trading.
@Binance Square Official #CryptoSelloffTriggersMultipleWhaleLiquidations #USSpotXRPETFsSeeLargestWeeklyOutflowIn8Months #WillFOMCMinutesReinforceRateHikeExpectations? #Binance #ChartSniper