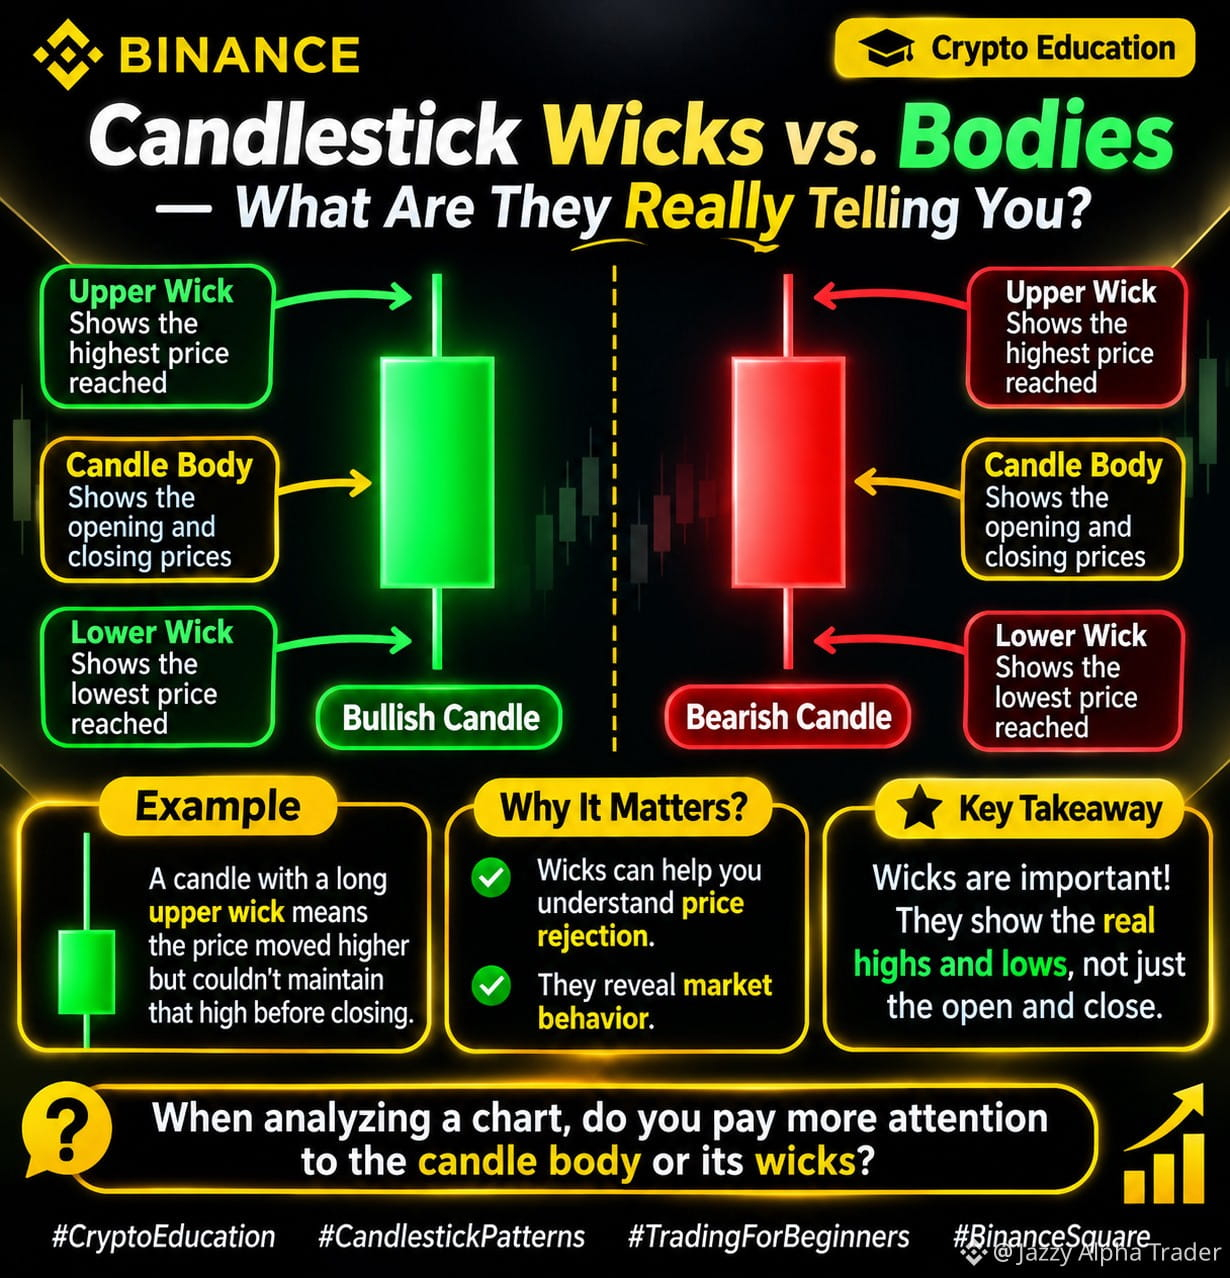
🕯️ A candle tells you MORE than just whether the price went up or down!
Have you ever wondered what those thin lines above and below a candlestick mean? 👀
They're called wicks (or shadows).
Here's the simple explanation:
🟩 The candle body shows the opening and closing prices.
⬆️ The upper wick shows the highest price reached.
⬇️ The lower wick shows the lowest price reached.
Example: If a candle has a long upper wick, it means the price moved higher but couldn't maintain that high before closing.
Why does this matter? Wicks can help beginners understand price rejection and market behavior.
💬 When analyzing a chart, do you pay more attention to the candle body or its wicks?
#CryptoEducation #WhatWillDriveCryptoandStocks’NextRebound? #TradFiForBeginners #KavaSaysAbnormalActivityLimitedToKavaLend #KavaSaysAbnormalActivityLimitedToKavaLend
Have you ever wondered what those thin lines above and below a candlestick mean? 👀
They're called wicks (or shadows).
Here's the simple explanation:
🟩 The candle body shows the opening and closing prices.
⬆️ The upper wick shows the highest price reached.
⬇️ The lower wick shows the lowest price reached.
Example: If a candle has a long upper wick, it means the price moved higher but couldn't maintain that high before closing.
Why does this matter? Wicks can help beginners understand price rejection and market behavior.
💬 When analyzing a chart, do you pay more attention to the candle body or its wicks?
#CryptoEducation #WhatWillDriveCryptoandStocks’NextRebound? #TradFiForBeginners #KavaSaysAbnormalActivityLimitedToKavaLend #KavaSaysAbnormalActivityLimitedToKavaLend