Everyone sees “Top Gainer” and thinks the bottom is in.
Flip it: a +9.86% bounce inside a 55% daily range, with price still pinned under a broken weekly shelf, usually marks a pause before continuation — not a reversal.
Here’s the trap hiding in plain sight 👇
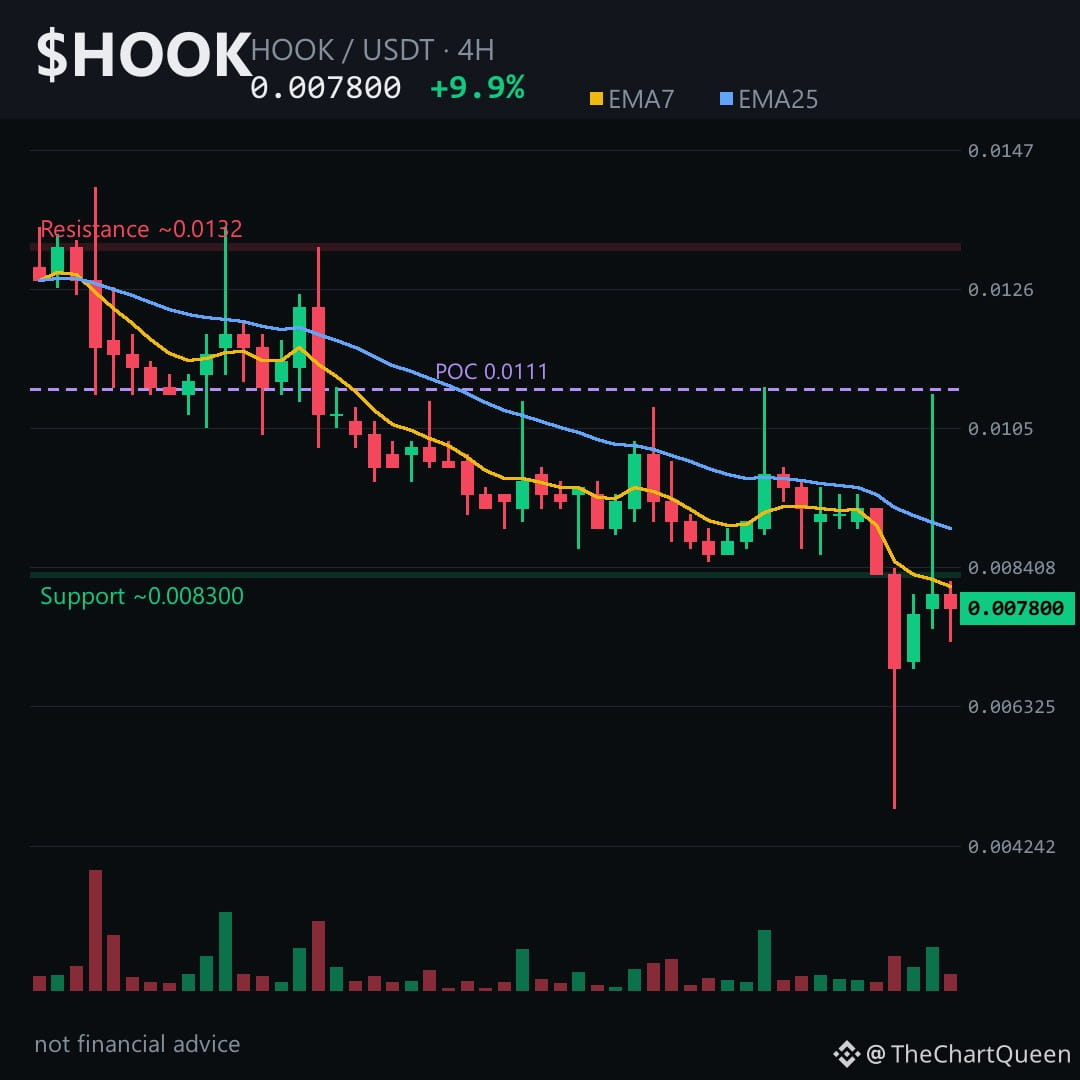
The 4H chart tells the truth. Price is near 0.0078, but short-term moving averages are stacked against it — the faster one still under the slower one. Bounces are being sold, not bought. RSI is trying to wake up near 38, but volume profile shows the heaviest traded zone sits far above, around 0.011. Price below that shelf means most of this move is underwater positioning.
The levels don’t lie 👇
If $HOOK can’t reclaim the 0.0082–0.0083 band as support, the path of least resistance stays lower. A 4H close back above it weakens the bearish read fast. Below it, the next liquidity pocket opens toward the 0.0071 area.
My read: this is a low-conviction bounce inside a high-conviction downtrend. The risk isn’t missing the pump — it’s mistaking a dead-cat wiggle for strength. Tap $HOOK and pull up the 4H chart to see how cleanly that shelf has rejected price.
Follow me for the update when 0.0082 either flips or fails — this level decides the next leg.
Which zone are you watching more closely: the 0.0082 reclaim or the 0.0071 retest on $HOOK? 👇
⚠️ Not financial advice. DYOR.
#HOOK #Crypto #BinanceSquare
Flip it: a +9.86% bounce inside a 55% daily range, with price still pinned under a broken weekly shelf, usually marks a pause before continuation — not a reversal.
Here’s the trap hiding in plain sight 👇
The 4H chart tells the truth. Price is near 0.0078, but short-term moving averages are stacked against it — the faster one still under the slower one. Bounces are being sold, not bought. RSI is trying to wake up near 38, but volume profile shows the heaviest traded zone sits far above, around 0.011. Price below that shelf means most of this move is underwater positioning.
The levels don’t lie 👇
If $HOOK can’t reclaim the 0.0082–0.0083 band as support, the path of least resistance stays lower. A 4H close back above it weakens the bearish read fast. Below it, the next liquidity pocket opens toward the 0.0071 area.
My read: this is a low-conviction bounce inside a high-conviction downtrend. The risk isn’t missing the pump — it’s mistaking a dead-cat wiggle for strength. Tap $HOOK and pull up the 4H chart to see how cleanly that shelf has rejected price.
Follow me for the update when 0.0082 either flips or fails — this level decides the next leg.
Which zone are you watching more closely: the 0.0082 reclaim or the 0.0071 retest on $HOOK? 👇
⚠️ Not financial advice. DYOR.
#HOOK #Crypto #BinanceSquare