ETH Breaks Down: Head & Shoulders Plays Out
◆━━━━━━━━━━━━━━━━━━
MARKET OVERVIEW
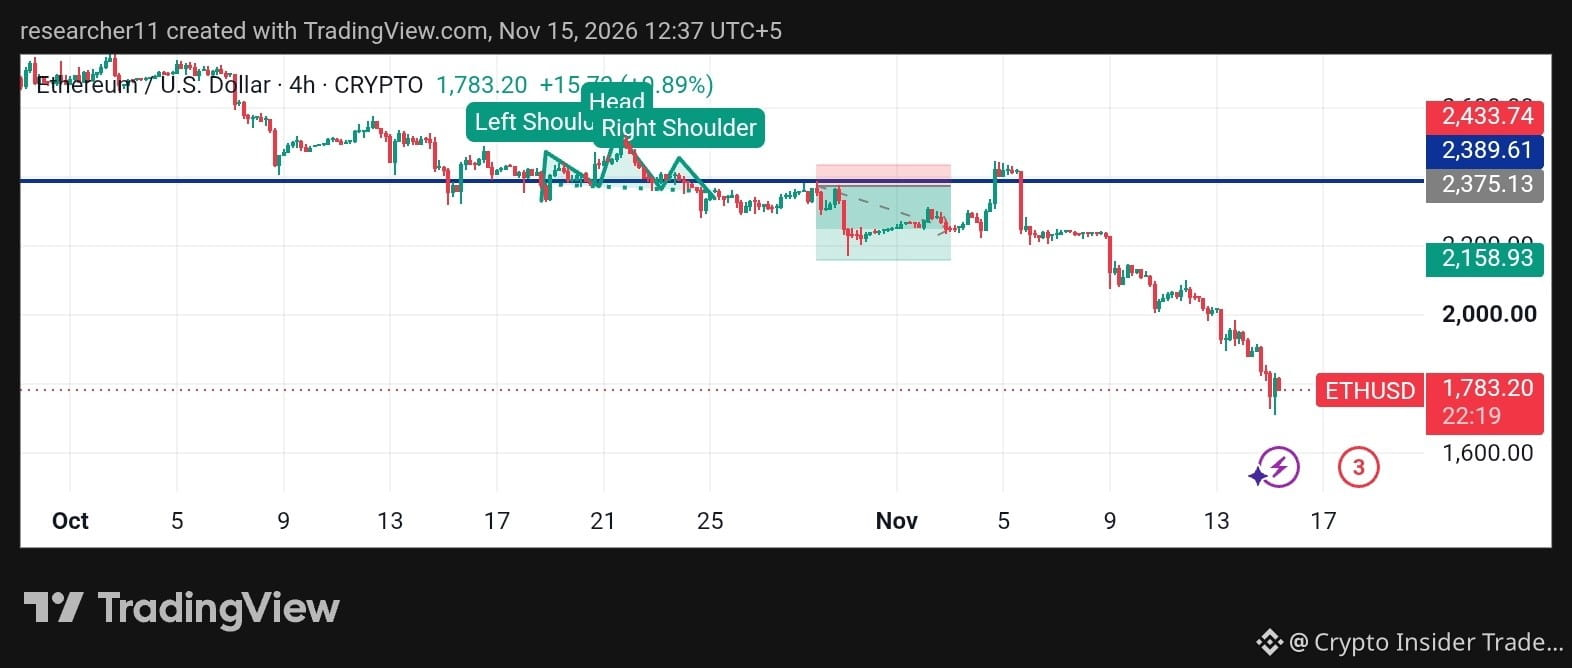
Ethereum is trading near $1,783 on the 4H chart, sitting close to recent lows after a sharp, steady decline. A small bounce of about +0.9% is not enough to change the trend. Volatility is elevated and sellers are still in control.
◆━━━━━━━━━━━━━━━━━━
TECHNICAL ANALYSIS
ETH formed a clear Head and Shoulders pattern around the $2,375 neckline. Price broke below it and kept falling, so the pattern played out. The neckline and the $2,158 zone are now overhead resistance. The long wick near $1,730 shows some buying interest, but there is no reversal signal yet.
🟢 BULLISH CASE: A reclaim of $2,000 with strong volume would be the first sign of strength. A move above $2,158 would improve the structure further.
🔴 BEARISH CASE: A 4H close below $1,730 could open the way to the $1,600 area.
⚪ NEUTRAL CASE: Sideways movement between $1,730 and $2,000 as the market cools off.
◆━━━━━━━━━━━━━━━━━━
KEY LEVELS
🔺 Resistance: R1 $2,000 | R2 $2,158 | R3 $2,375
🔻 Support: S1 $1,730 | S2 $1,600
◆━━━━━━━━━━━━━━━━━━
CONTEXT
ETH is moving in line with Bitcoin. If BTC stays weak, ETH will likely struggle to recover.
◆━━━━━━━━━━━━━━━━━━
OUTLOOK
Watch the $1,730 floor and the $2,000 psychological level. A confirmed reversal needs a clear higher high first.
Not financial advice. Always DYOR.
#CryptoSelloffTriggersMultipleWhaleLiquidations #USSpotXRPETFsSeeLargestWeeklyOutflowIn8Months #WORPTLetsTouristsConvertCryptoToThaiBaht $ETH
◆━━━━━━━━━━━━━━━━━━
MARKET OVERVIEW
Ethereum is trading near $1,783 on the 4H chart, sitting close to recent lows after a sharp, steady decline. A small bounce of about +0.9% is not enough to change the trend. Volatility is elevated and sellers are still in control.
◆━━━━━━━━━━━━━━━━━━
TECHNICAL ANALYSIS
ETH formed a clear Head and Shoulders pattern around the $2,375 neckline. Price broke below it and kept falling, so the pattern played out. The neckline and the $2,158 zone are now overhead resistance. The long wick near $1,730 shows some buying interest, but there is no reversal signal yet.
🟢 BULLISH CASE: A reclaim of $2,000 with strong volume would be the first sign of strength. A move above $2,158 would improve the structure further.
🔴 BEARISH CASE: A 4H close below $1,730 could open the way to the $1,600 area.
⚪ NEUTRAL CASE: Sideways movement between $1,730 and $2,000 as the market cools off.
◆━━━━━━━━━━━━━━━━━━
KEY LEVELS
🔺 Resistance: R1 $2,000 | R2 $2,158 | R3 $2,375
🔻 Support: S1 $1,730 | S2 $1,600
◆━━━━━━━━━━━━━━━━━━
CONTEXT
ETH is moving in line with Bitcoin. If BTC stays weak, ETH will likely struggle to recover.
◆━━━━━━━━━━━━━━━━━━
OUTLOOK
Watch the $1,730 floor and the $2,000 psychological level. A confirmed reversal needs a clear higher high first.
Not financial advice. Always DYOR.
#CryptoSelloffTriggersMultipleWhaleLiquidations #USSpotXRPETFsSeeLargestWeeklyOutflowIn8Months #WORPTLetsTouristsConvertCryptoToThaiBaht $ETH