$PYTH: Macro Liquidity Versus Micro Bursts in PYTH
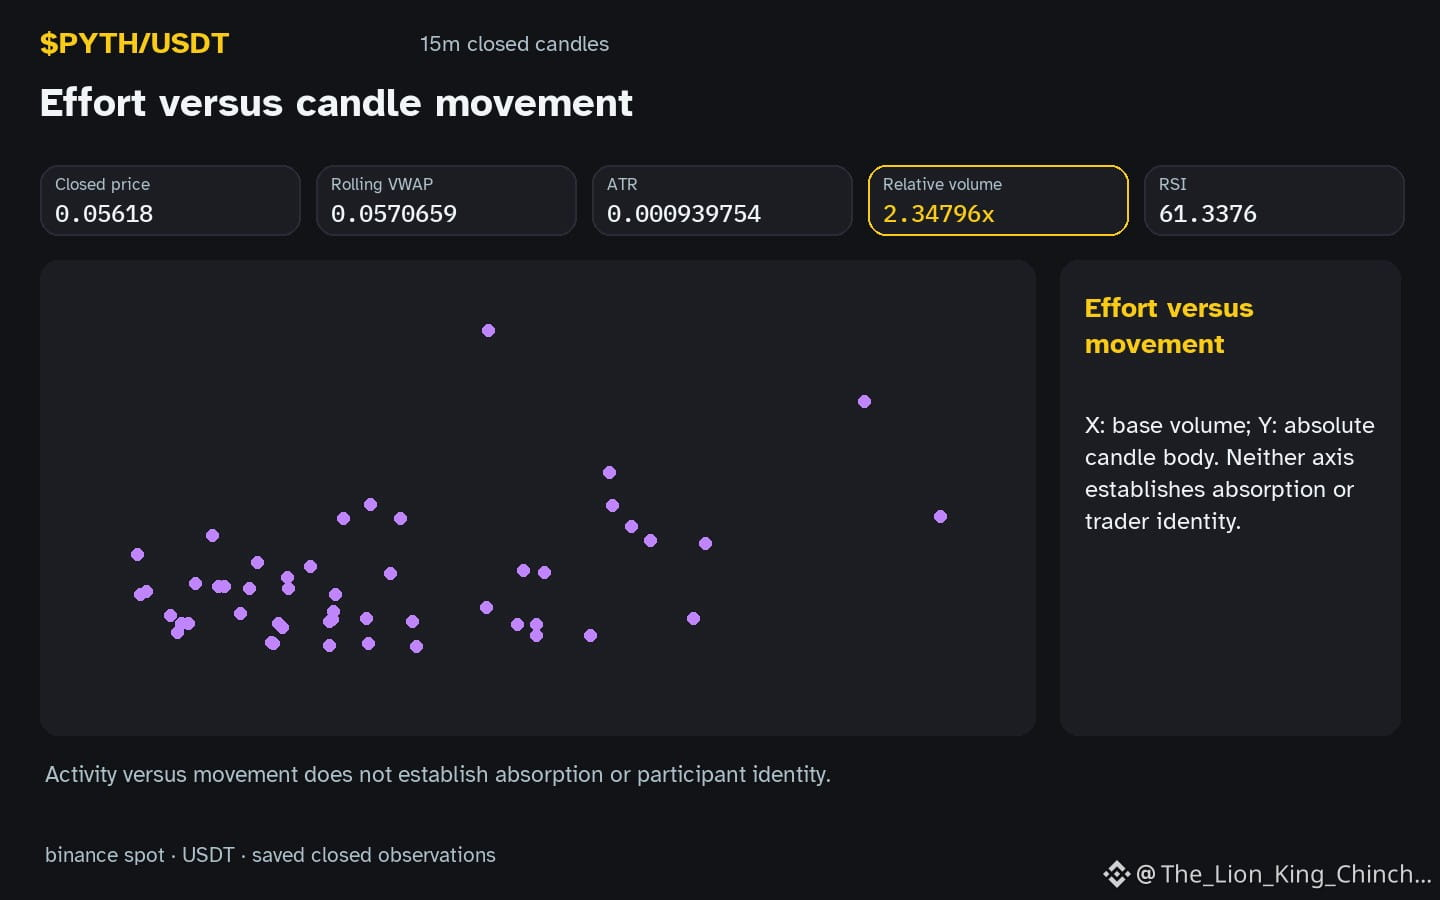
Consider $PYTH showing hourly direction up with volume above baseline. Does 2.35x baseline measure broad market liquidity or a short participation burst? The clue is that relative volume compares current activity to preceding candles. It does not reveal total market capitalization or institutional flow. An alternative reading treats the spike as a micro event. This could happen while macro liquidity remains stable elsewhere. Price may reflect local demand rather than a sector-wide shift. Candles alone cannot confirm causation between these scales. A counterexample would show $PYTH volume rising while peer assets remain quiet. This weakens the macro linkage hypothesis. Conversely, if peers also show elevated volume, the micro burst interpretation gains context. RSI 61.3 helps gauge momentum speed but does not measure liquidity depth. The support level at 0.05152 represents a local bar bound. It is not a global floor validated by macro data. A self-check asks whether the volume surge aligns with a specific time window. If the burst fades without price continuation, the micro explanation holds more weight. If price consolidates near resistance 0.05622 despite high volume, the macro thesis weakens. Reassess when the next closed candle shows volume returning to baseline. If that candle closes below 0.05152, the burst was likely noise. If it holds above 0.05152, the interpretation remains open. This approach distinguishes temporary activity from sustained interest. It avoids assuming hidden motives behind the trade size. The thought experiment holds value as a framework for comparing scales. It reminds us that volume ratios are relative, not absolute measures of asset strength.
Probabilistic market research, not a recommendation or guaranteed return.
The comparison to keep in mind: $ETH has hourly direction up and volume above its baseline; $BANANAS31 has hourly direction up and volume above its baseline. This alone does not establish correlation.
#PYTH #ETH
Consider $PYTH showing hourly direction up with volume above baseline. Does 2.35x baseline measure broad market liquidity or a short participation burst? The clue is that relative volume compares current activity to preceding candles. It does not reveal total market capitalization or institutional flow. An alternative reading treats the spike as a micro event. This could happen while macro liquidity remains stable elsewhere. Price may reflect local demand rather than a sector-wide shift. Candles alone cannot confirm causation between these scales. A counterexample would show $PYTH volume rising while peer assets remain quiet. This weakens the macro linkage hypothesis. Conversely, if peers also show elevated volume, the micro burst interpretation gains context. RSI 61.3 helps gauge momentum speed but does not measure liquidity depth. The support level at 0.05152 represents a local bar bound. It is not a global floor validated by macro data. A self-check asks whether the volume surge aligns with a specific time window. If the burst fades without price continuation, the micro explanation holds more weight. If price consolidates near resistance 0.05622 despite high volume, the macro thesis weakens. Reassess when the next closed candle shows volume returning to baseline. If that candle closes below 0.05152, the burst was likely noise. If it holds above 0.05152, the interpretation remains open. This approach distinguishes temporary activity from sustained interest. It avoids assuming hidden motives behind the trade size. The thought experiment holds value as a framework for comparing scales. It reminds us that volume ratios are relative, not absolute measures of asset strength.
Probabilistic market research, not a recommendation or guaranteed return.
The comparison to keep in mind: $ETH has hourly direction up and volume above its baseline; $BANANAS31 has hourly direction up and volume above its baseline. This alone does not establish correlation.
#PYTH #ETH