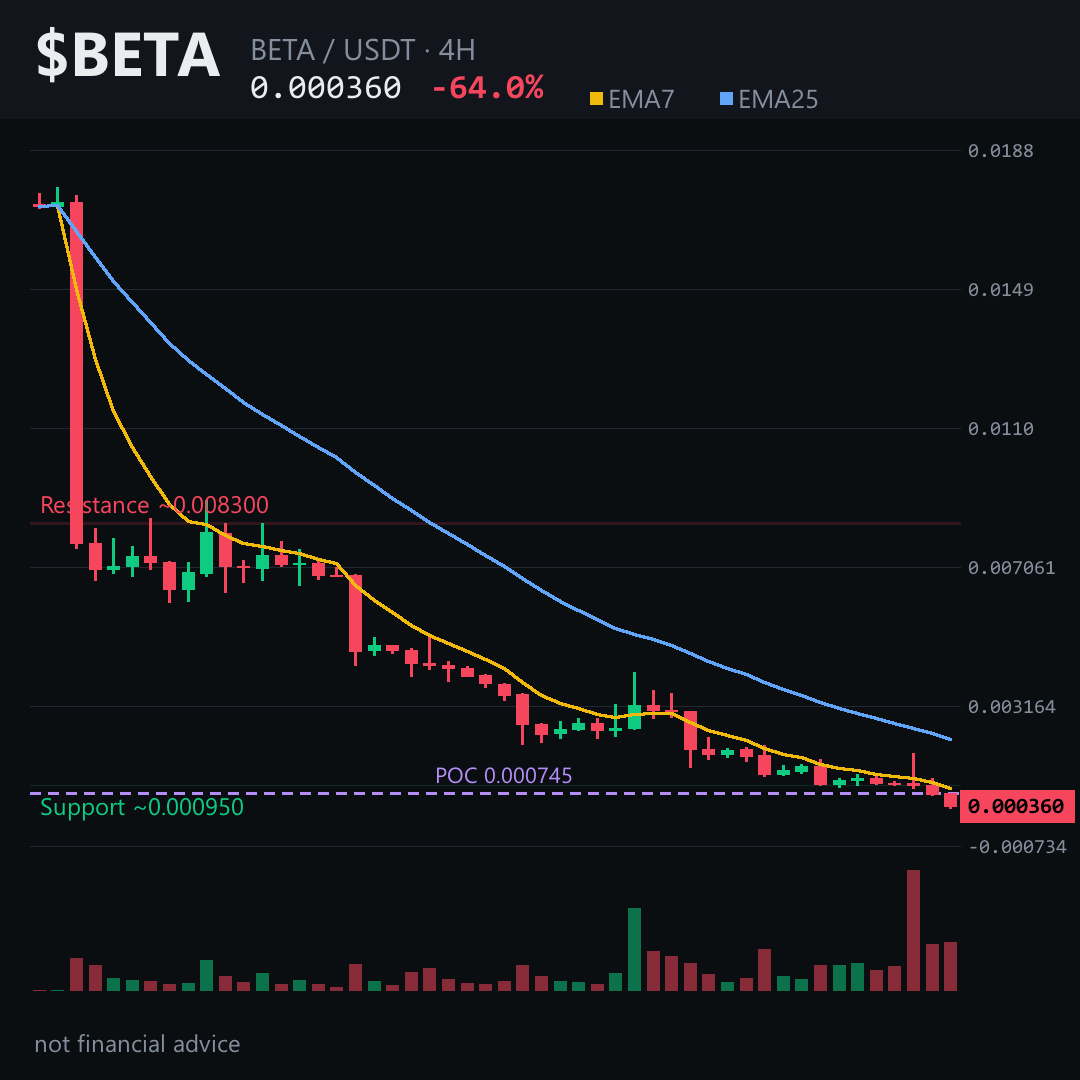
Imagine watching a building get demolished — floor by floor, then the whole frame gives way at once. That’s $BETA right now.
The daily chart tells the brutal truth: price traded near 0.002 just 48 hours ago, now it’s around 0.00036. That’s a collapse, not a dip. The last 4H candle printed a 51% single-candle wipeout.
Here’s the part worth leaning into: the bearish fair value gap between roughly 0.00230 and 0.00286 is a long way above current price. If price ever attempts a recovery, that’s likely where the next heavy rejection lives. But the more immediate story is the level right around 0.00037–0.00038. As long as price stays beneath it, the path of least resistance still points down toward the 0.00032–0.00033 zone. A 4H close back above 0.00038 would be the first real sign this down-leg is exhausted.
My read: this is a falling knife with almost no visible support until price finds a base near the 0.00031 area — and even that’s more of a reference than a floor.
If you’re watching $BETA, pull up the 4H and trace that gap — it’s the only clean structure left on the chart.
I’ll keep an eye on whether that 0.00037–0.00038 zone holds as resistance or finally gives way — follow along if you want the update when it resolves.
What level are you watching most closely on $BETA right now? 👇
⚠️ Not financial advice. DYOR.
#BETA #Crypto #BinanceSquare
The daily chart tells the brutal truth: price traded near 0.002 just 48 hours ago, now it’s around 0.00036. That’s a collapse, not a dip. The last 4H candle printed a 51% single-candle wipeout.
Here’s the part worth leaning into: the bearish fair value gap between roughly 0.00230 and 0.00286 is a long way above current price. If price ever attempts a recovery, that’s likely where the next heavy rejection lives. But the more immediate story is the level right around 0.00037–0.00038. As long as price stays beneath it, the path of least resistance still points down toward the 0.00032–0.00033 zone. A 4H close back above 0.00038 would be the first real sign this down-leg is exhausted.
My read: this is a falling knife with almost no visible support until price finds a base near the 0.00031 area — and even that’s more of a reference than a floor.
If you’re watching $BETA, pull up the 4H and trace that gap — it’s the only clean structure left on the chart.
I’ll keep an eye on whether that 0.00037–0.00038 zone holds as resistance or finally gives way — follow along if you want the update when it resolves.
What level are you watching most closely on $BETA right now? 👇
⚠️ Not financial advice. DYOR.
#BETA #Crypto #BinanceSquare