
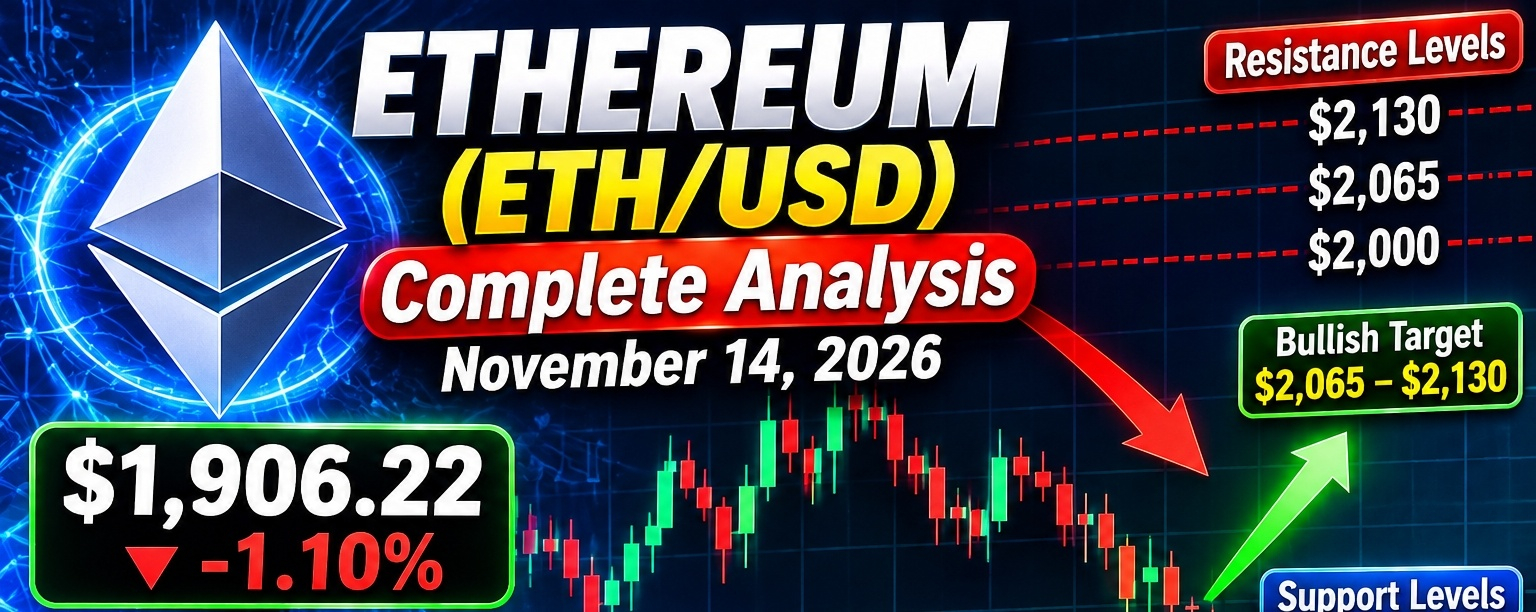

Ethereum ($ETH /USD) – Complete Market Technical, fundamental and trading analysis 14 November 2026
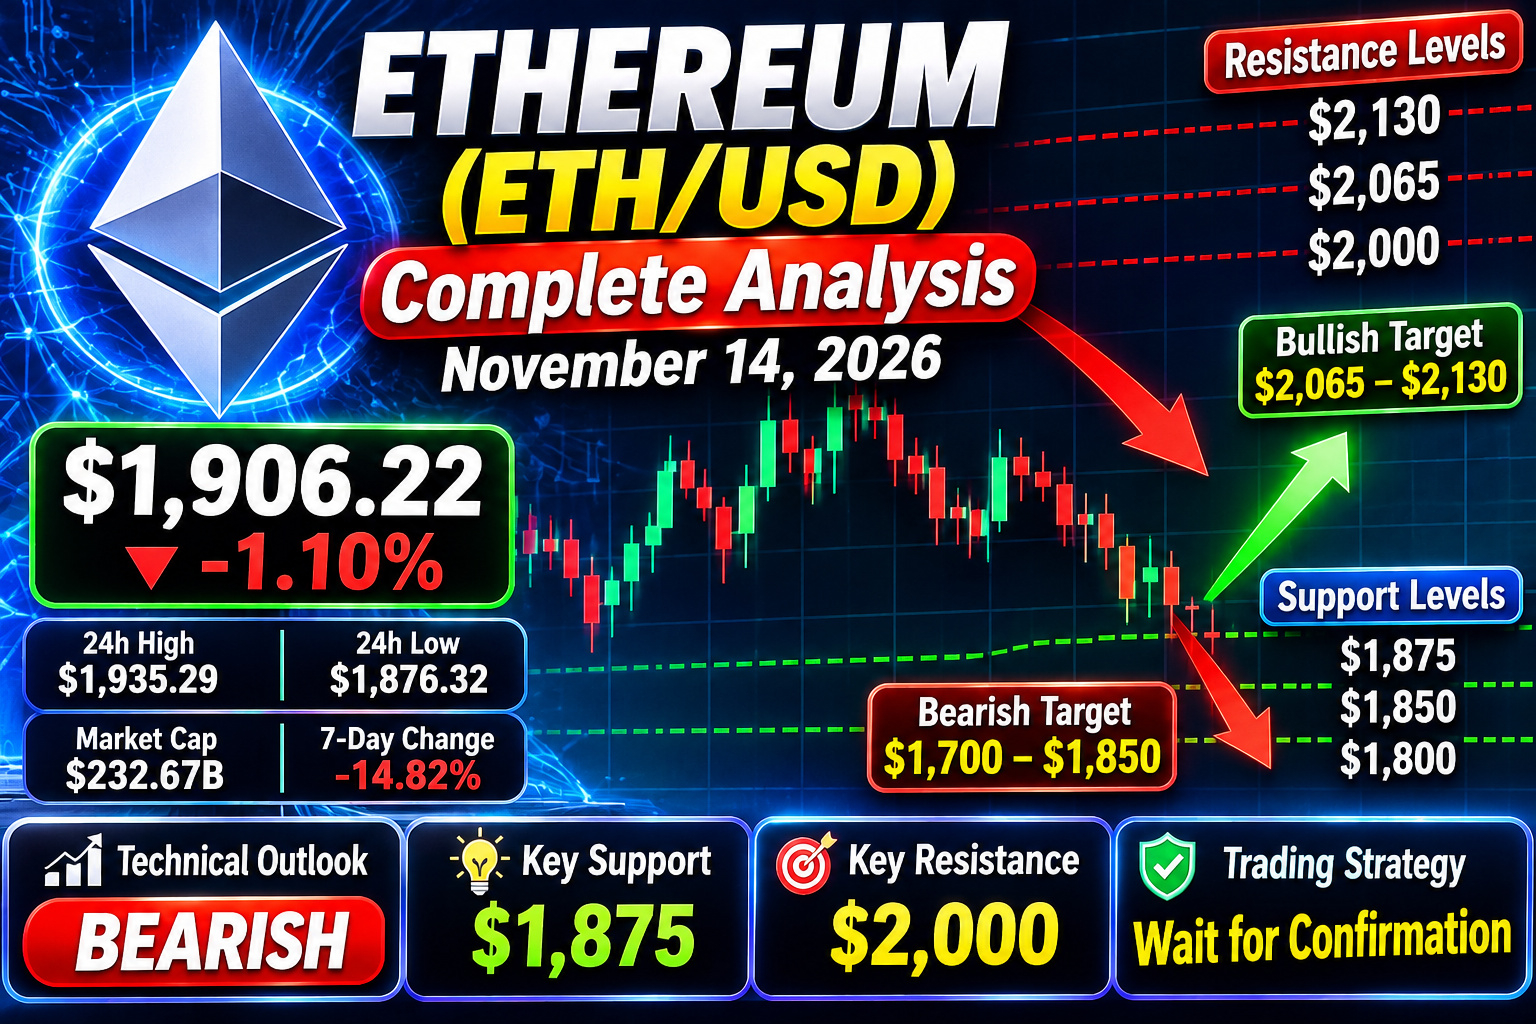
Ethereum (ETH) is one of the leading cryptocurrencies and the foundation of a large ecosystem of decentralized finance, smart contracts, NFTs, stablecoins and Web3 applications.

This analysis covers:
* Current market direction
* Technical indicators
* Support and resistance
* Bullish and bearish scenarios
* Trading strategies
* Fundamental outlook
* Risk management
### 1\. Current $ETH /USD market situation
Ethereum (ETH/USD)
Bearish
### $1,906.22
−1.10% daily snapshot
Daily high
$1,935.29
Daily low
$1,876.32
Market cap
~$232.67B
7-day performance
−14.82%
November 14 market snapshot. Exchange prices vary. OHLCX Markets +1
Market interpretation: Ethereum is under considerable selling pressure. Its decline over the past week indicates that buyers have not yet regained control.
### 2\. Technical indicator analysis
| Indicator | Reading | Signal |
| --------------- | --------------------------- | ---------------- |
| RSI family | Oversold | Potential bounce |
| MACD | −118.17 | Bearish |
| MACD signal | −90.63 | Bearish |
| ADX | 29.30 | Strong trend |
| +DI | 10.87 | Weak buyers |
| −DI | 33.34 | Sellers dominant |
| Overall signals | 10 sell / 4 buy / 4 neutral | Bearish |
OHLCX Markets
What this means:
* Oversold oscillators suggest a recovery could develop.
* Negative MACD indicates bearish momentum.
* ADX near 29 indicates a relatively strong trend.
* Sellers currently have a clear advantage.
Technical outlook: Strong bearish pressure
### 3\. Important support and resistance levels
The following are approximate trading zones derived from recent price action, not guaranteed exchange order-book levels.
| Level | ETH price | Importance |
| ------------ | --------- | ------------------------ |
| Resistance 3 | $2,130 | Major resistance |
| Resistance 2 | $2,065 | Strong resistance |
| Resistance 1 | $2,000 | Psychological resistance |
| Pivot zone | $1,930 | Near-term trend |
| Support 1 | $1,875 | Immediate support |
| Support 2 | $1,850 | Psychological support |
| Support 3 | $1,800 | Major downside zone |
Recent trading data shows a daily low around $1,876 and previous closes around $1,930 and $2,020. CoinGlass
Important levels:
* Above $2,000: recovery becomes more convincing.
* Below $1,875: downside risk increases.
* Around $1,800: watch for potential buying interest.
### 4\. Bullish scenario – ETH price prediction
Bullish recovery possibility
If $ETH holds $1,875 and buyers return with strong volume, possible targets include:
| Target | Price |
| -------- | ------ |
| Target 1 | $1,950 |
| Target 2 | $2,000 |
| Target 3 | $2,065 |
| Target 4 | $2,130 |
Bullish confirmation:
* Strong 4-hour close above $1,950.
* Increasing spot trading volume.
* RSI recovering above 50.
* MACD bullish crossover.
A sustained move above $2,000 would strengthen the recovery scenario.
### 5\. Bearish scenario – ETH downside risk
Bearish continuation possibility
If sellers break the $1,875 support:
| Target | Price |
| -------- | ------ |
| Target 1 | $1,850 |
| Target 2 | $1,800 |
| Target 3 | $1,750 |
| Target 4 | $1,700 |
A daily close below $1,850 would increase the risk of further downside.
Do not assume oversold conditions guarantee an immediate reversal.
### 6\. Ethereum futures and market sentiment
Latest available derivatives snapshot:
| Metric | Value |
| ------------------ | -------- |
| Futures volume | $47.33B |
| Spot volume | $3.10B |
| Open interest | $23.08B |
| Funding rate | +0.0001% |
| Long liquidations | $183.62M |
| Short liquidations | $57.79M |
CoinGlass
Interpretation:
* Futures activity is substantially higher than spot activity.
* Long liquidations exceed short liquidations.
* Open interest has declined, suggesting leveraged positions are being reduced.
* Funding is close to neutral.
This reflects considerable market volatility and forced selling.
Ethereum has several important long-term strengths:
Positive factors
* Leading smart-contract ecosystem.
* Large decentralized finance market.
* Stablecoin and tokenization infrastructure.
* Layer-2 scaling ecosystem.
* Institutional investment potential.
* ETH staking and network security.
Major risks
* Competition from Solana and other blockchains.
* Lower network activity and transaction-fee revenue.
* Regulatory uncertainty.
* Institutional fund outflows.
* Broader cryptocurrency market weakness.
Long-term fundamentals should be assessed separately from short-term price momentum.
### 8\. ETH/USD trading strategies
These are conditional educational setups, not guaranteed trades.
| Strategy | Entry condition | Target |
| -------------------- | --------------- | ------------- |
| Support bounce | $1,875–$1,900 | $1,950–$2,000 |
| Breakout long | Above $2,000 | $2,065–$2,130 |
| Breakdown short | Below $1,875 | $1,850–$1,800 |
| Resistance rejection | $1,950–$2,000 | $1,900–$1,875 |
My preferred strategy: Wait for confirmation rather than buying immediately into a falling market.
Risk management:
* Risk approximately 1% of capital per trade.
* Avoid excessive leverage.
* Use stop-loss orders.
* Confirm direction on the 4-hour and daily charts.
### 9\. ETH/USD forecast
Short-term forecast
Next 24–48 hours
Bearish bias
### $1,850–$2,000
Scenario outlook
| Market scenario | Price zone |
| --------------- | ------------- |
| Bearish | $1,700–$1,850 |
| Neutral | $1,875–$2,000 |
| Bullish | $2,065–$2,130 |
Illustrative scenario ranges, not guaranteed predictions.
### 10\. Final trading verdict
Overall outlook: Bearish
| Category | Assessment |
| ----------------- | ---------- |
| Short-term trend | Bearish |
| Medium-term trend | Bearish |
| RSI condition | Oversold |
| MACD | Bearish |
| Buying pressure | Weak |
| Selling pressure | Strong |
| Major support | $1,875 |
| Major resistance | $2,000 |
My conclusion: ETH/USD is currently showing bearish momentum. The $1,875 support zone is particularly important. If buyers defend it, a recovery toward $1,950–$2,000 is possible. If it breaks, $1,800 and $1,750 become important downside areas.
I would wait for a confirmed reversal before taking a large long position.
This is educational market analysis, not financial advice. Cryptocurrency prices can change rapidly.
#ETH🔥🔥🔥🔥🔥🔥 #Ethereum #ETHAnalysis #ETHUSDT #TrendingPredictions