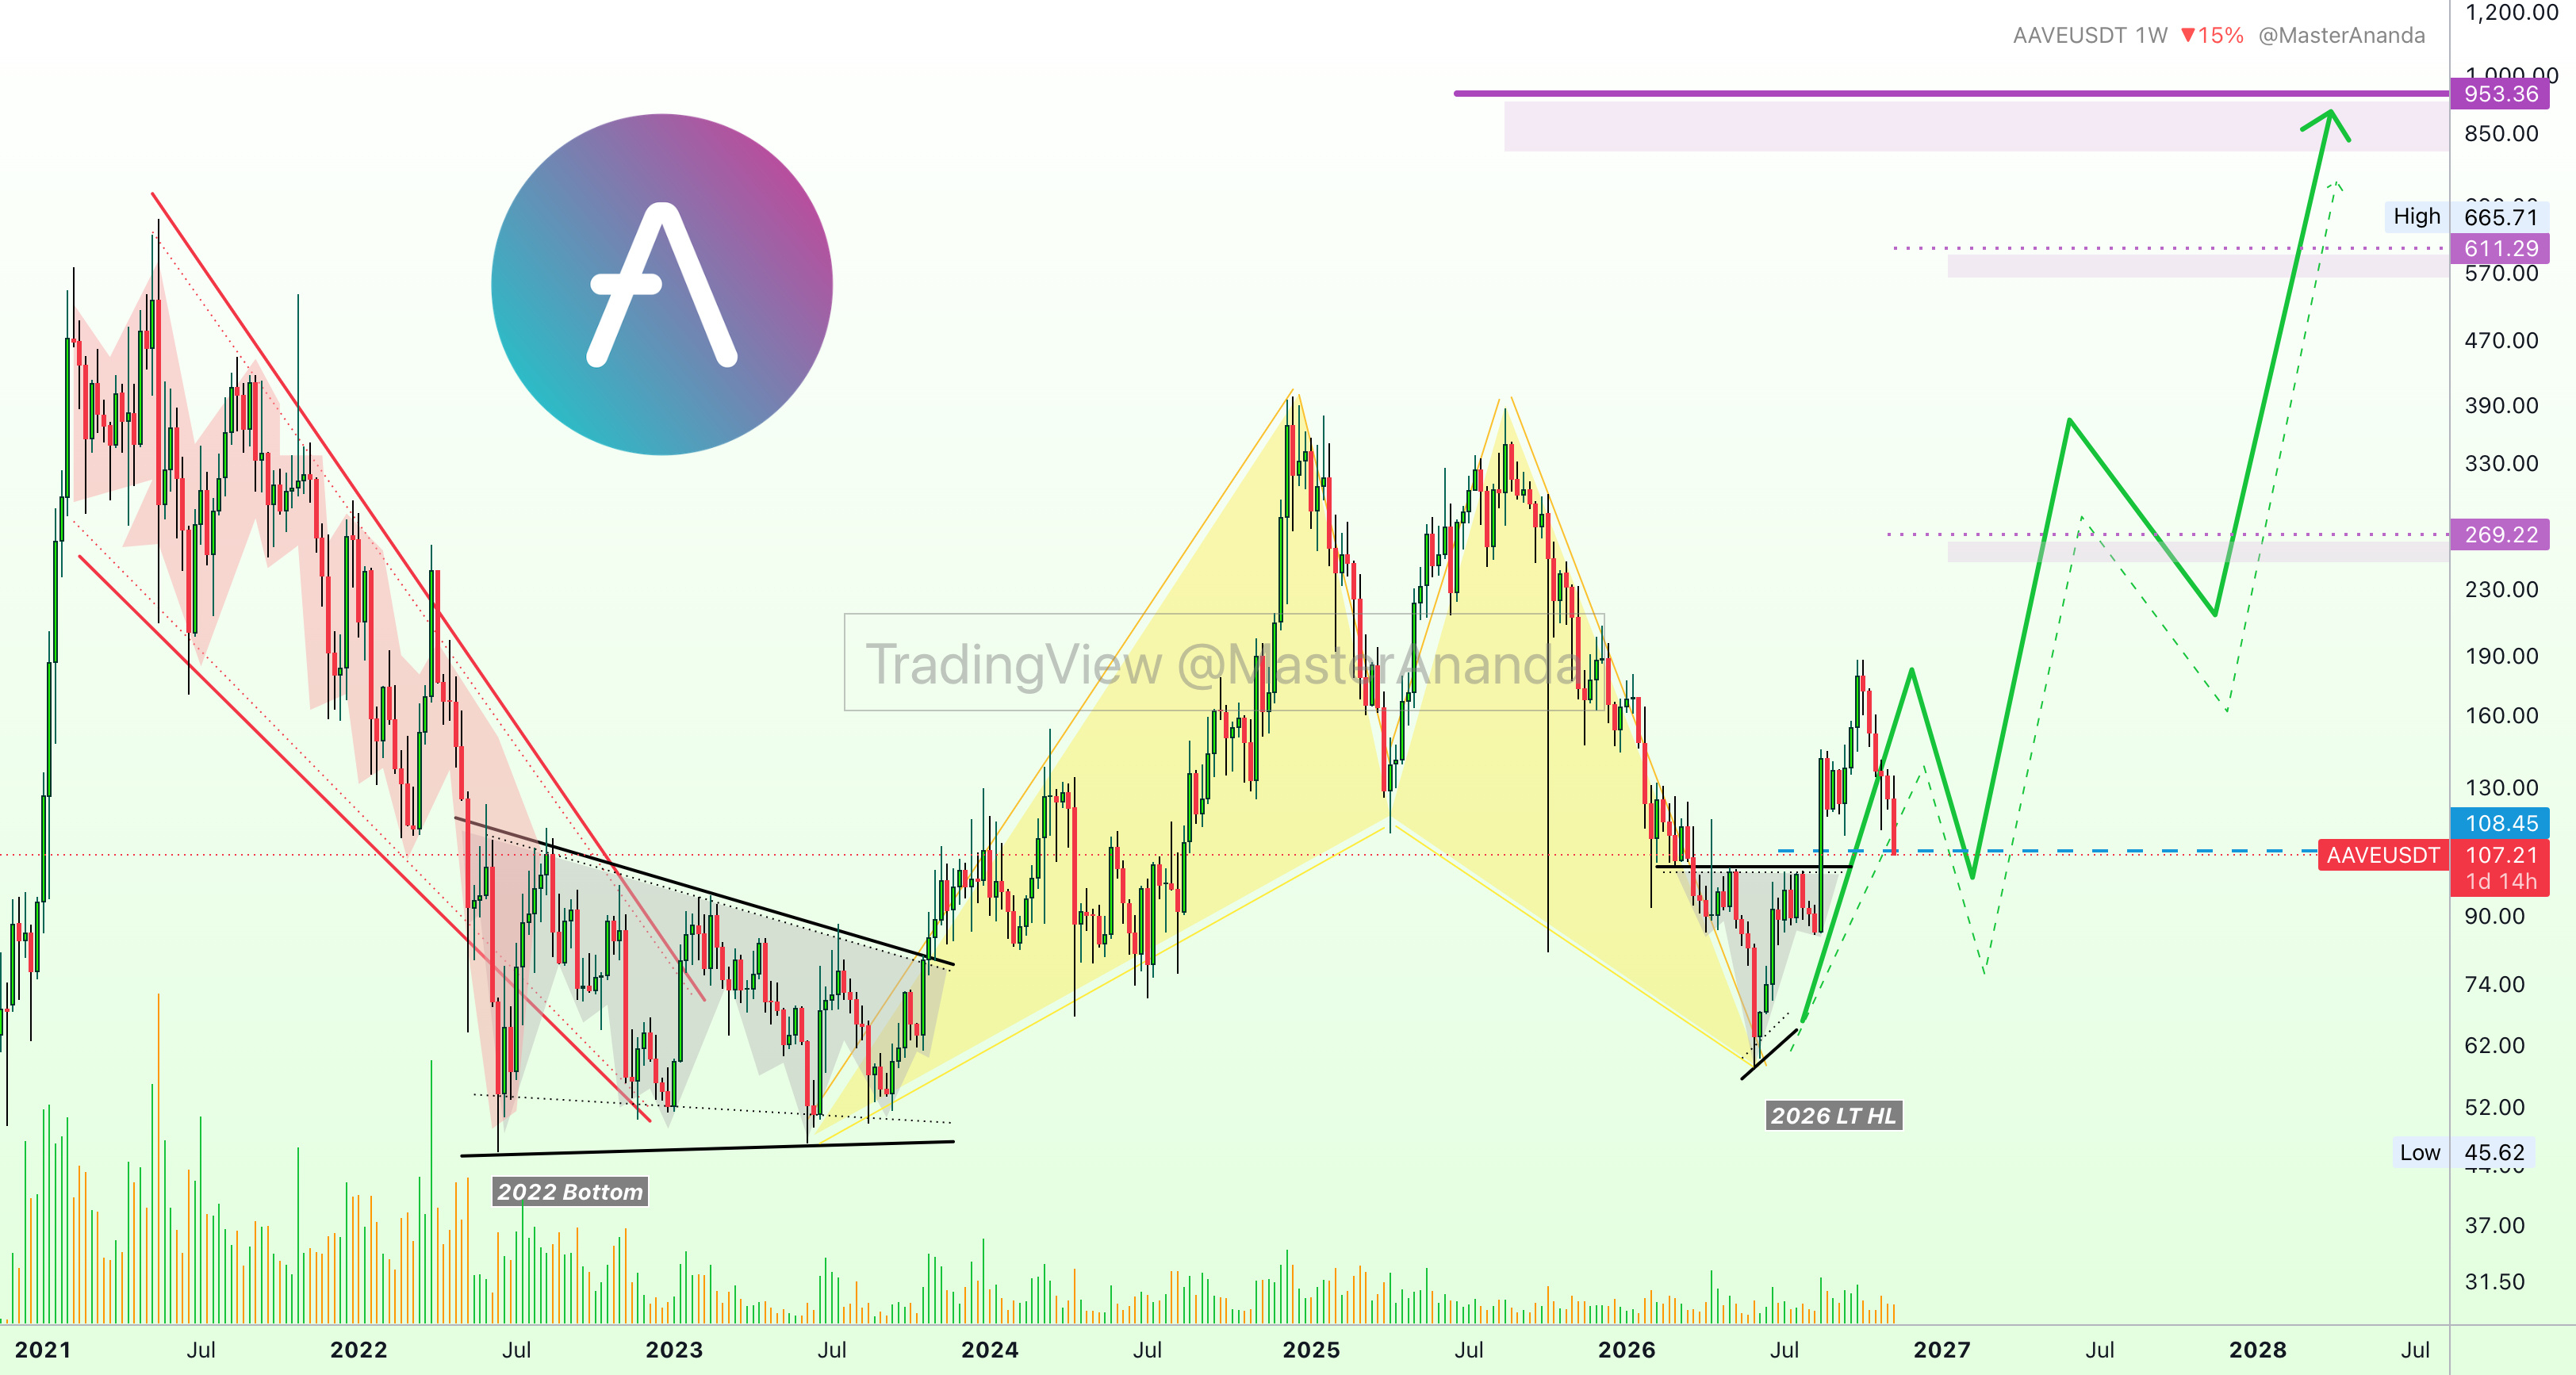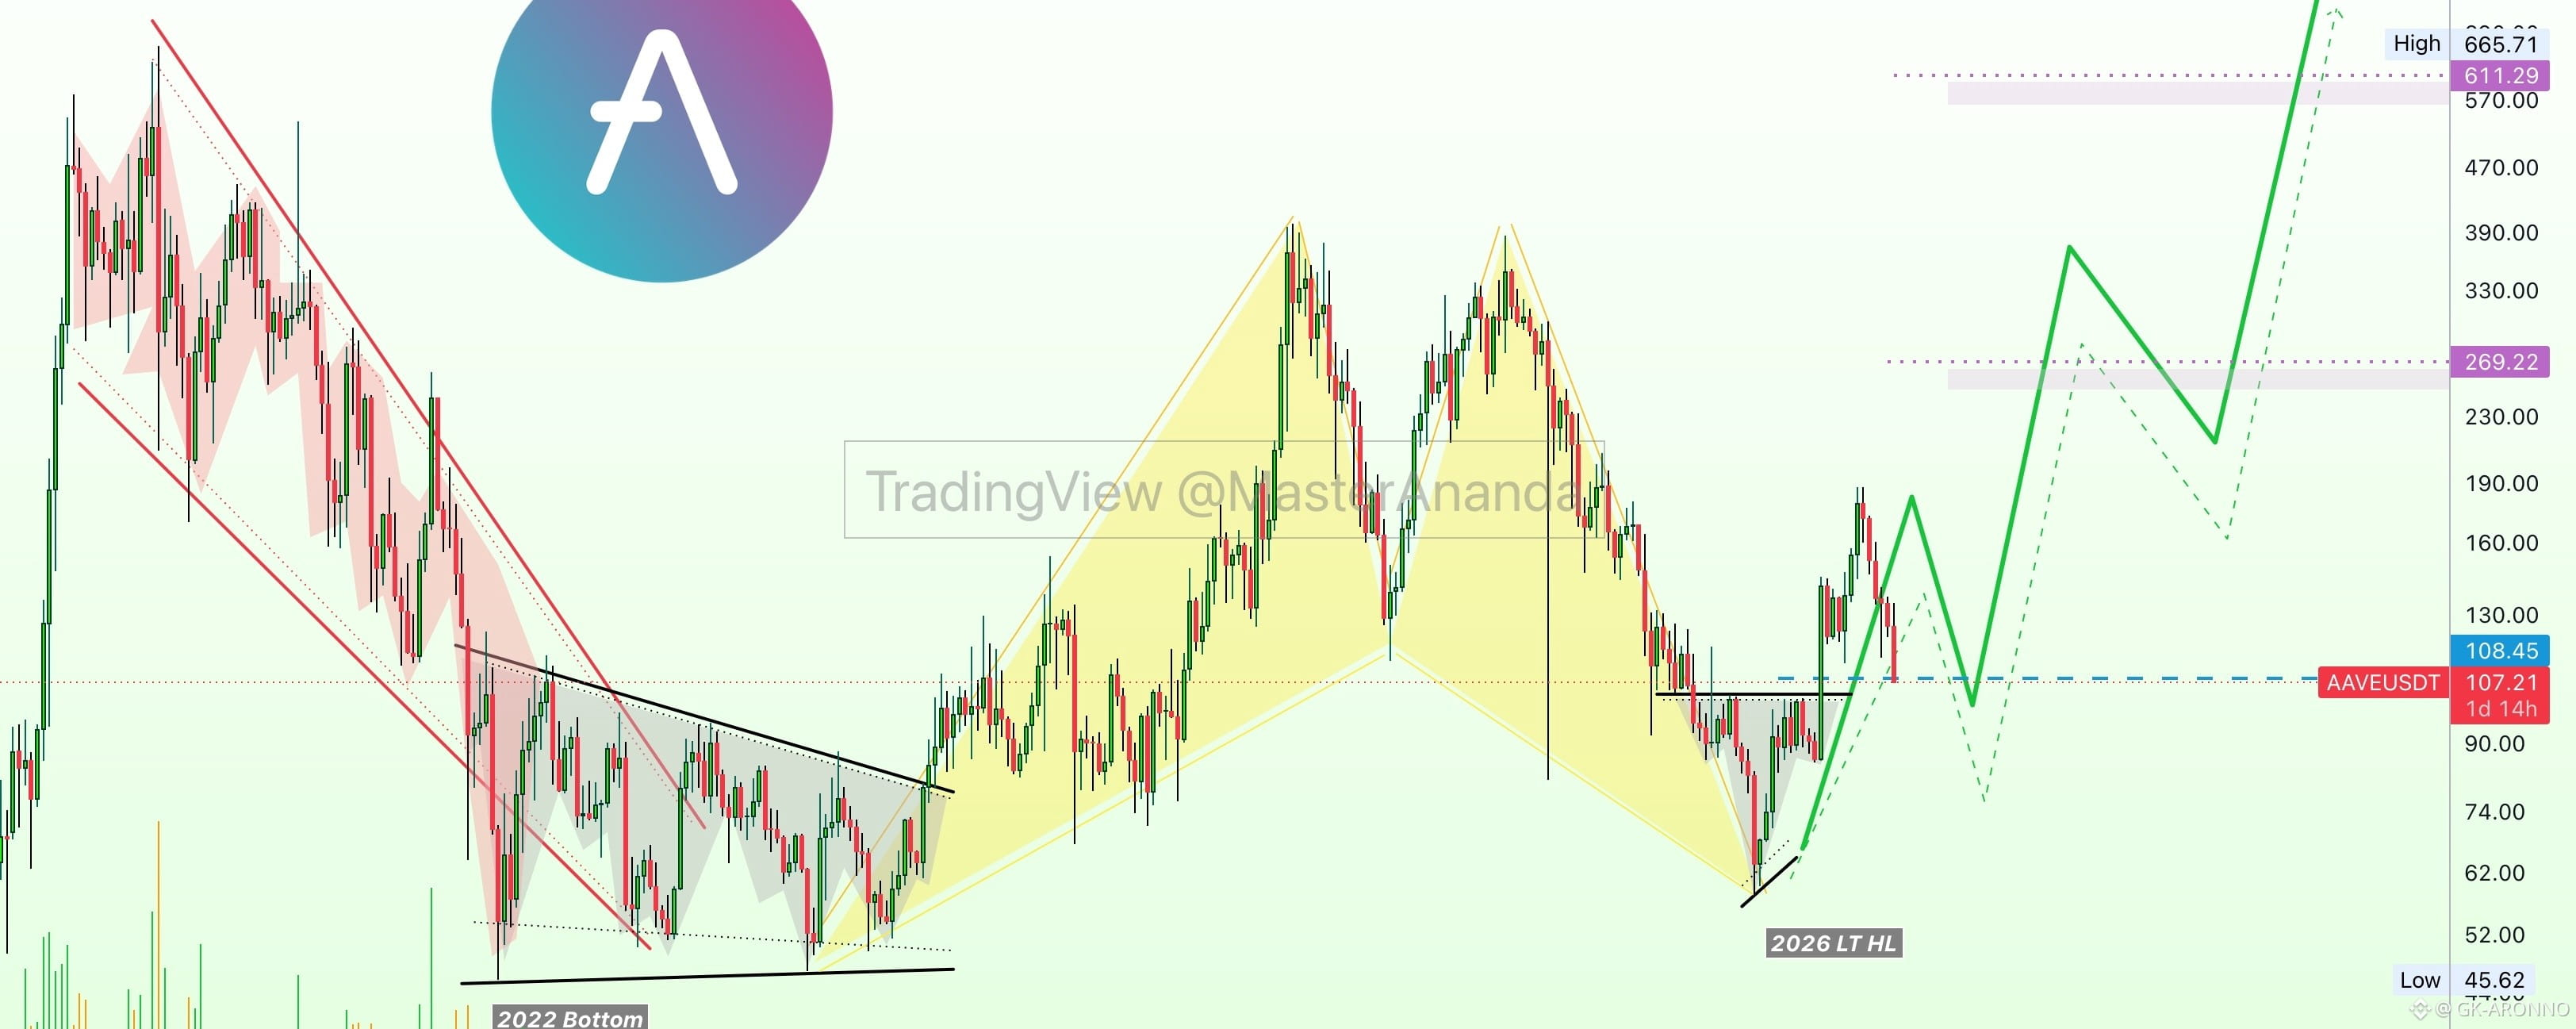


I gave you AAVEUSDT recently, here it goes again. This chart setup shows the full chart with a new all-time high, the map for the complete bullish impulse that started June 2026—the chart is simple.
A very simple chart with a harmonic pattern. I am highlighting two different bottom formations. I am highlighting a long-term higher low. All three patterns, the two bottoms and the cypher, support a new all-time high and this is what you see marked purple on the chart.
We can see the unfoldment of a major bullish wave. AAVE is moving lower within a correction, support being lost short-term. This support level being lost, will propel the next bullish jump.
One more bullish wave leads to another correction followed by additional growth. The fifth wave is the one that is most likely to hit a new all-time high.
After the third wave, which can take several months to end fully, some consolidation can happen. That is, instead of wave 5 appearing right away after the end of wave 4, we can see multiple months of sideways (AAVE building a support base) and from this baseline level the last and final bullish-jump.
Always allow for strong variations on the shape of the wave.
The green arrow on the chart is not meant to depict the exact price fluctuations, it is only meant to point out the main chart direction. Only the direction is relevant when it comes to the drawing, the bullish impulse can unfold in an unlimited variety of waves.
The main theme to be extracted from this chart, is the occurrence of a prolonged period of higher highs and higher lows on AAVE vs USDT.
Thank you for reading.
Namaste.