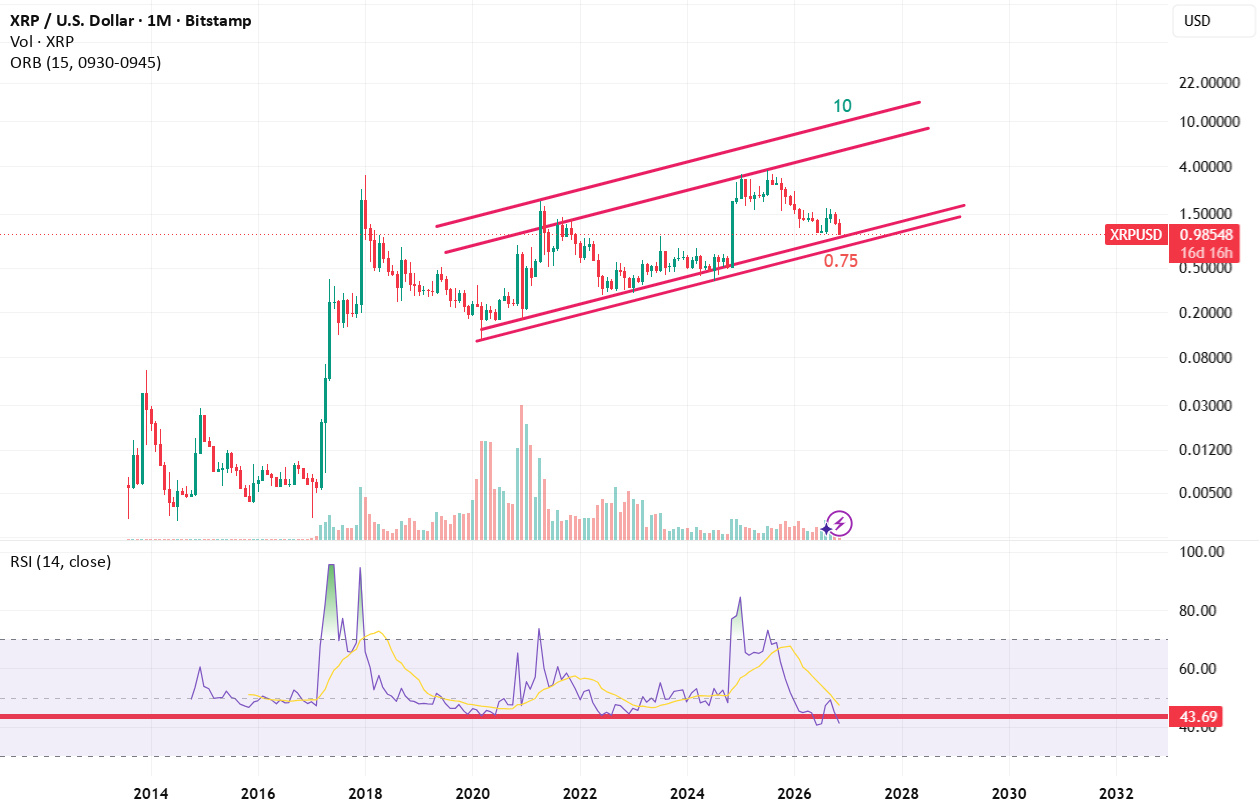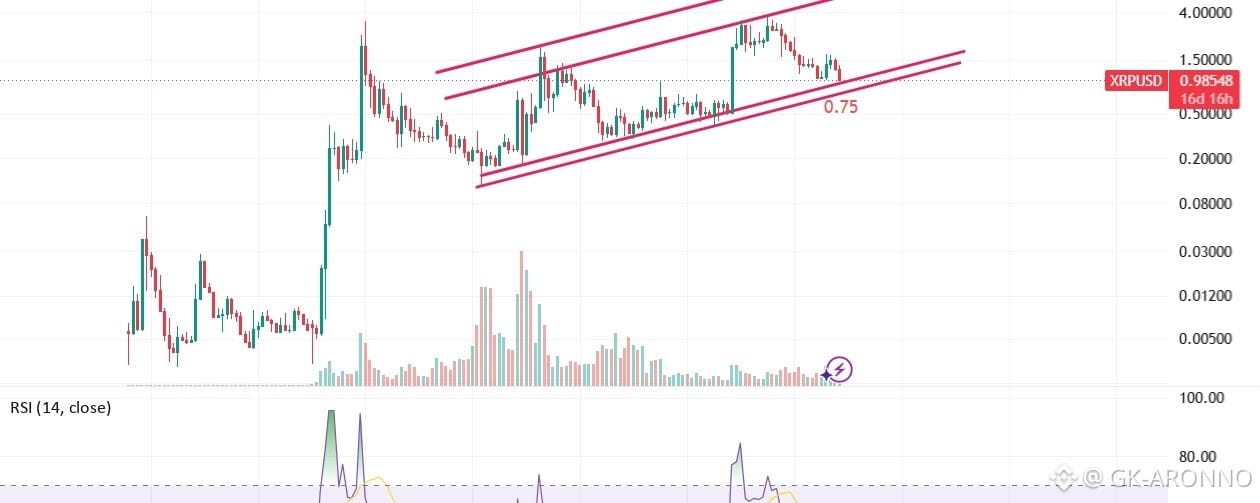


XRP is currently trading around the $0.98 level, and the monthly chart is showing an interesting technical structure.
1. Ascending Channel Structure 📈
XRP continues to develop within a broader ascending channel. The rising trendlines suggest that the long-term market structure remains potentially bullish, provided price respects the lower boundary of the channel.
2. Key Support – $0.75
The $0.75 region is an important support level to watch. Holding above this area would help preserve the broader bullish structure. A confirmed breakdown below it could indicate a deeper correction and a potential change in market sentiment.
3. RSI Momentum
The monthly RSI is currently around 41, below the 50 midpoint. This indicates weakening bullish momentum, but it is not yet an extreme oversold reading. A recovery above 50 would be an encouraging sign for buyers.
4. Potential Upside – $10
The upper trendline represents a possible long-term upside projection toward the $10 region. However, this is a long-term technical scenario, not a guaranteed price target. XRP would first need to regain momentum and break through intermediate resistance levels.
My Outlook:
I am watching the lower ascending trendline and the $0.75 support area closely. As long as the broader structure remains intact, I believe the possibility of another major bullish expansion remains on the table.
The coming monthly candles will be important in determining whether XRP is simply correcting within its ascending structure or preparing for a deeper move down.
Patience is key. Let the chart confirm the next move.