

BTCUSDT.P
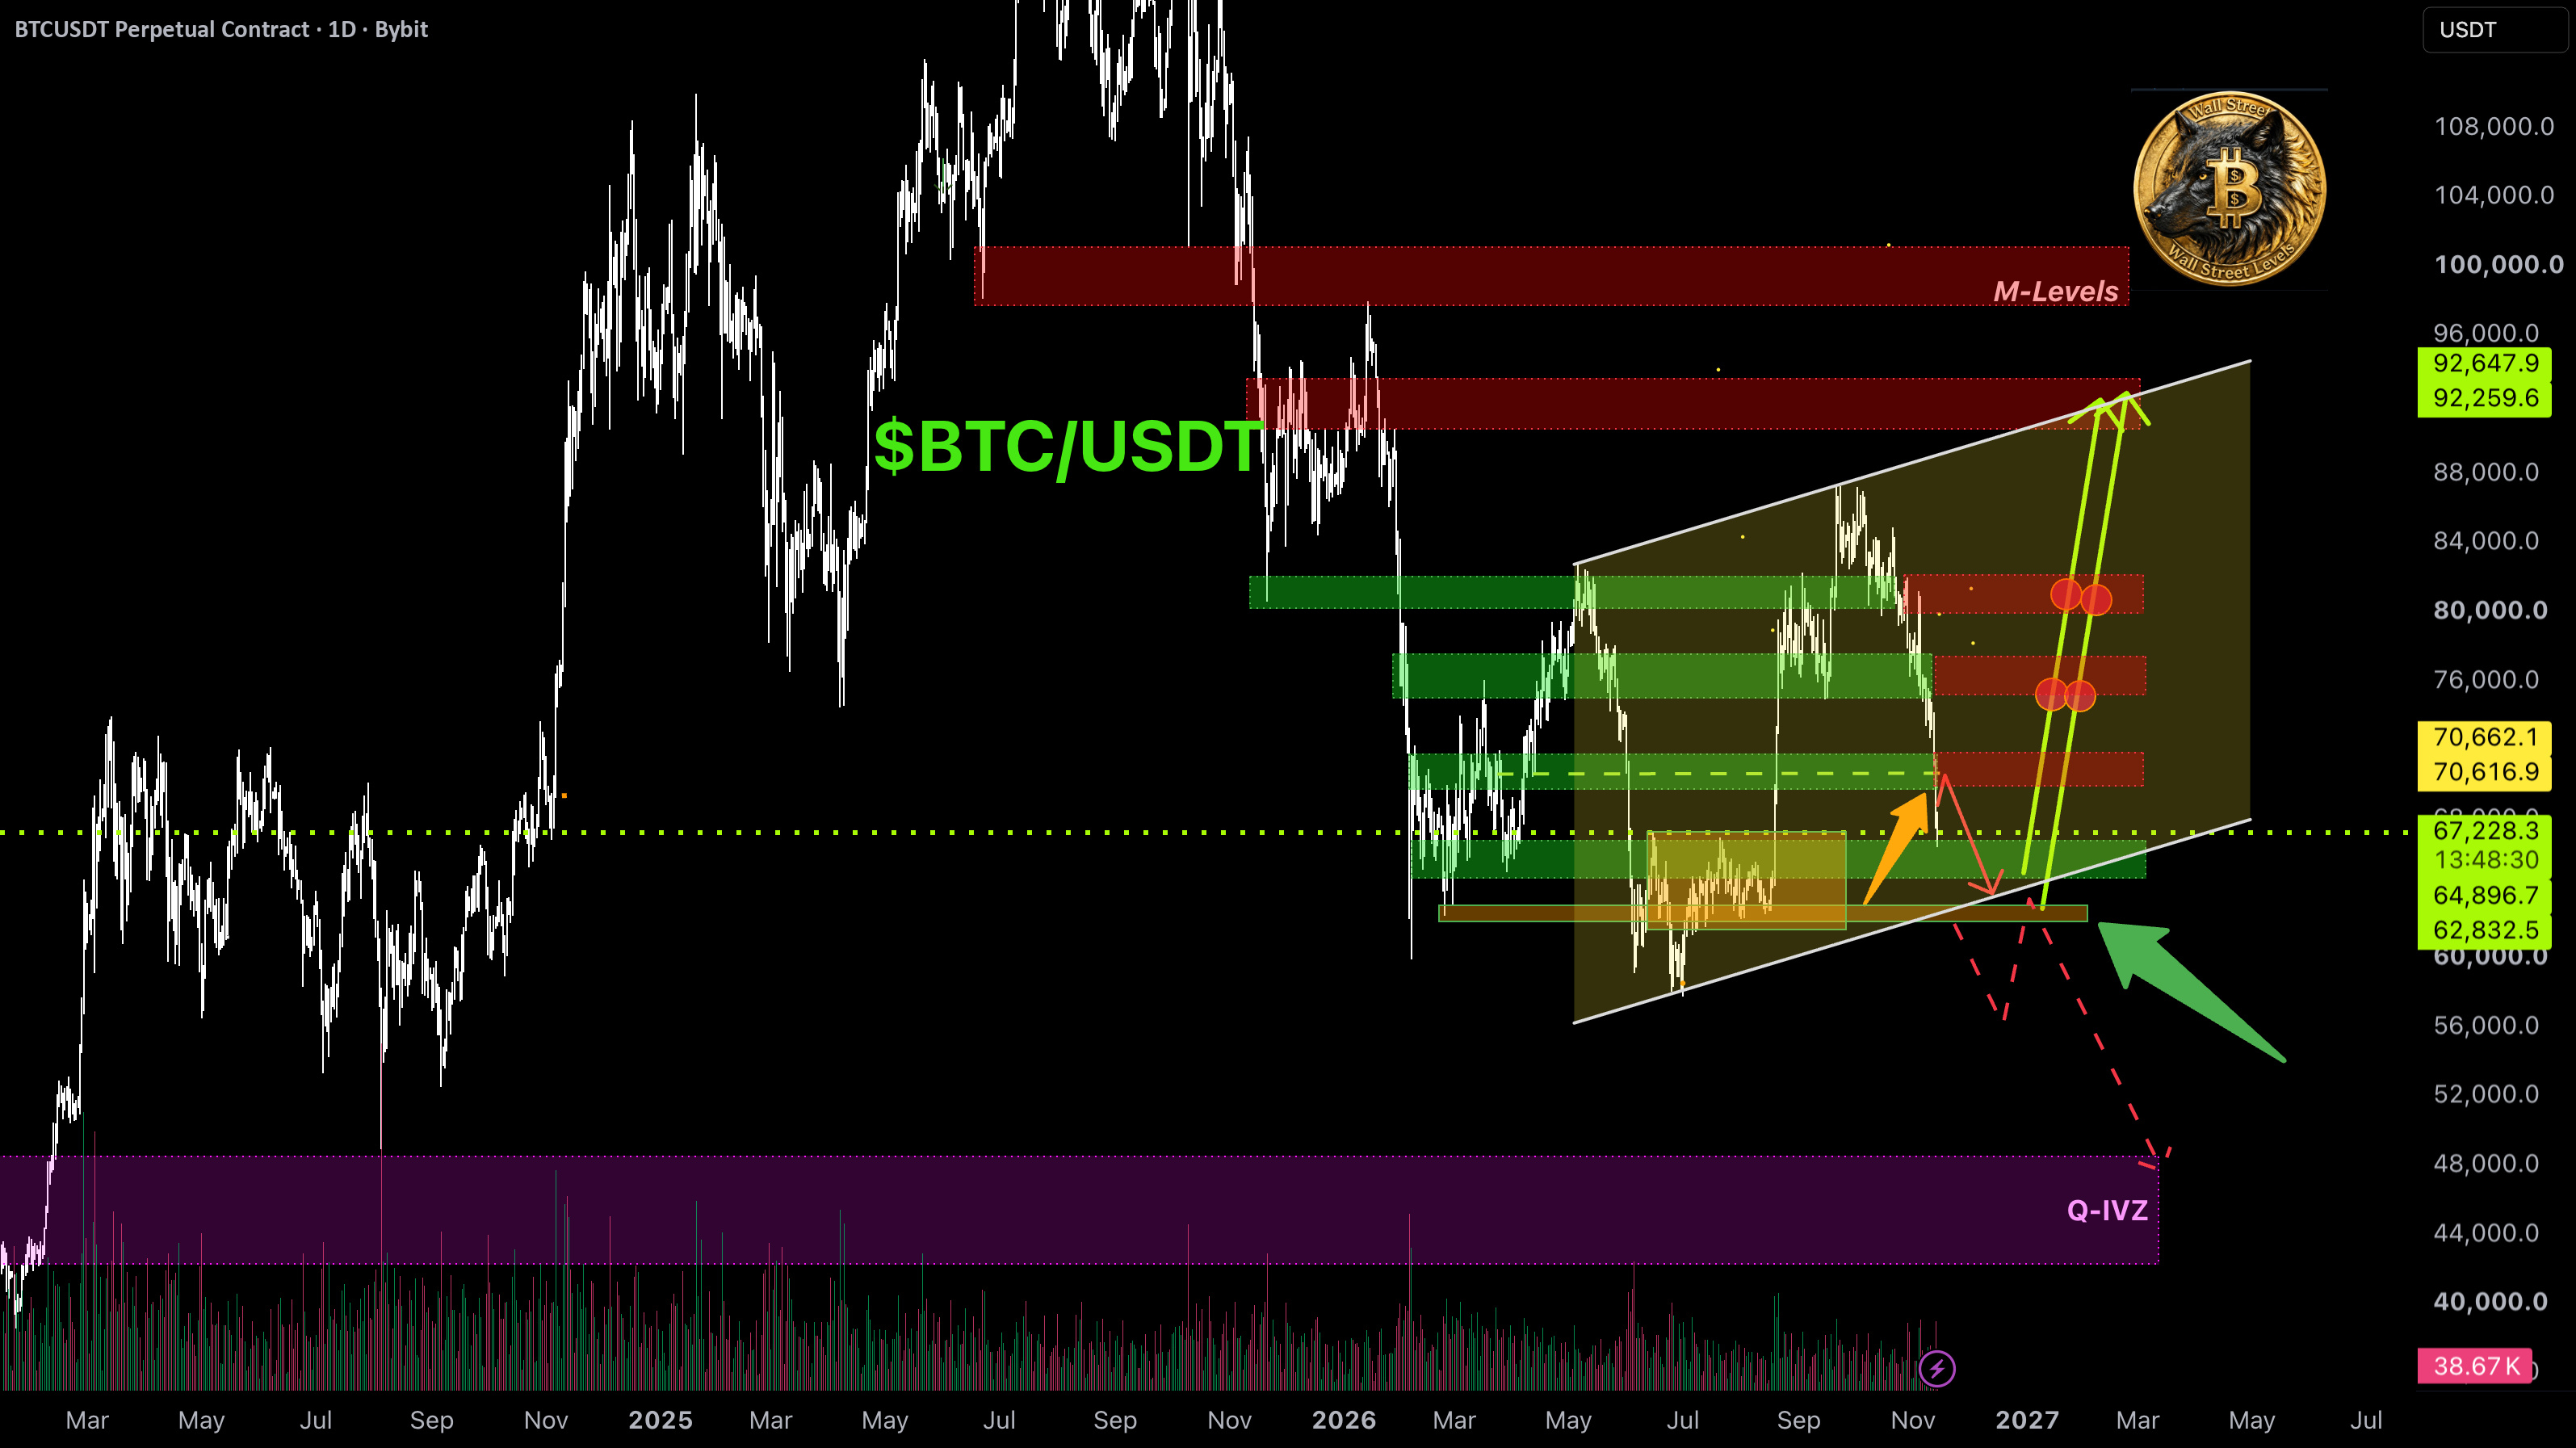
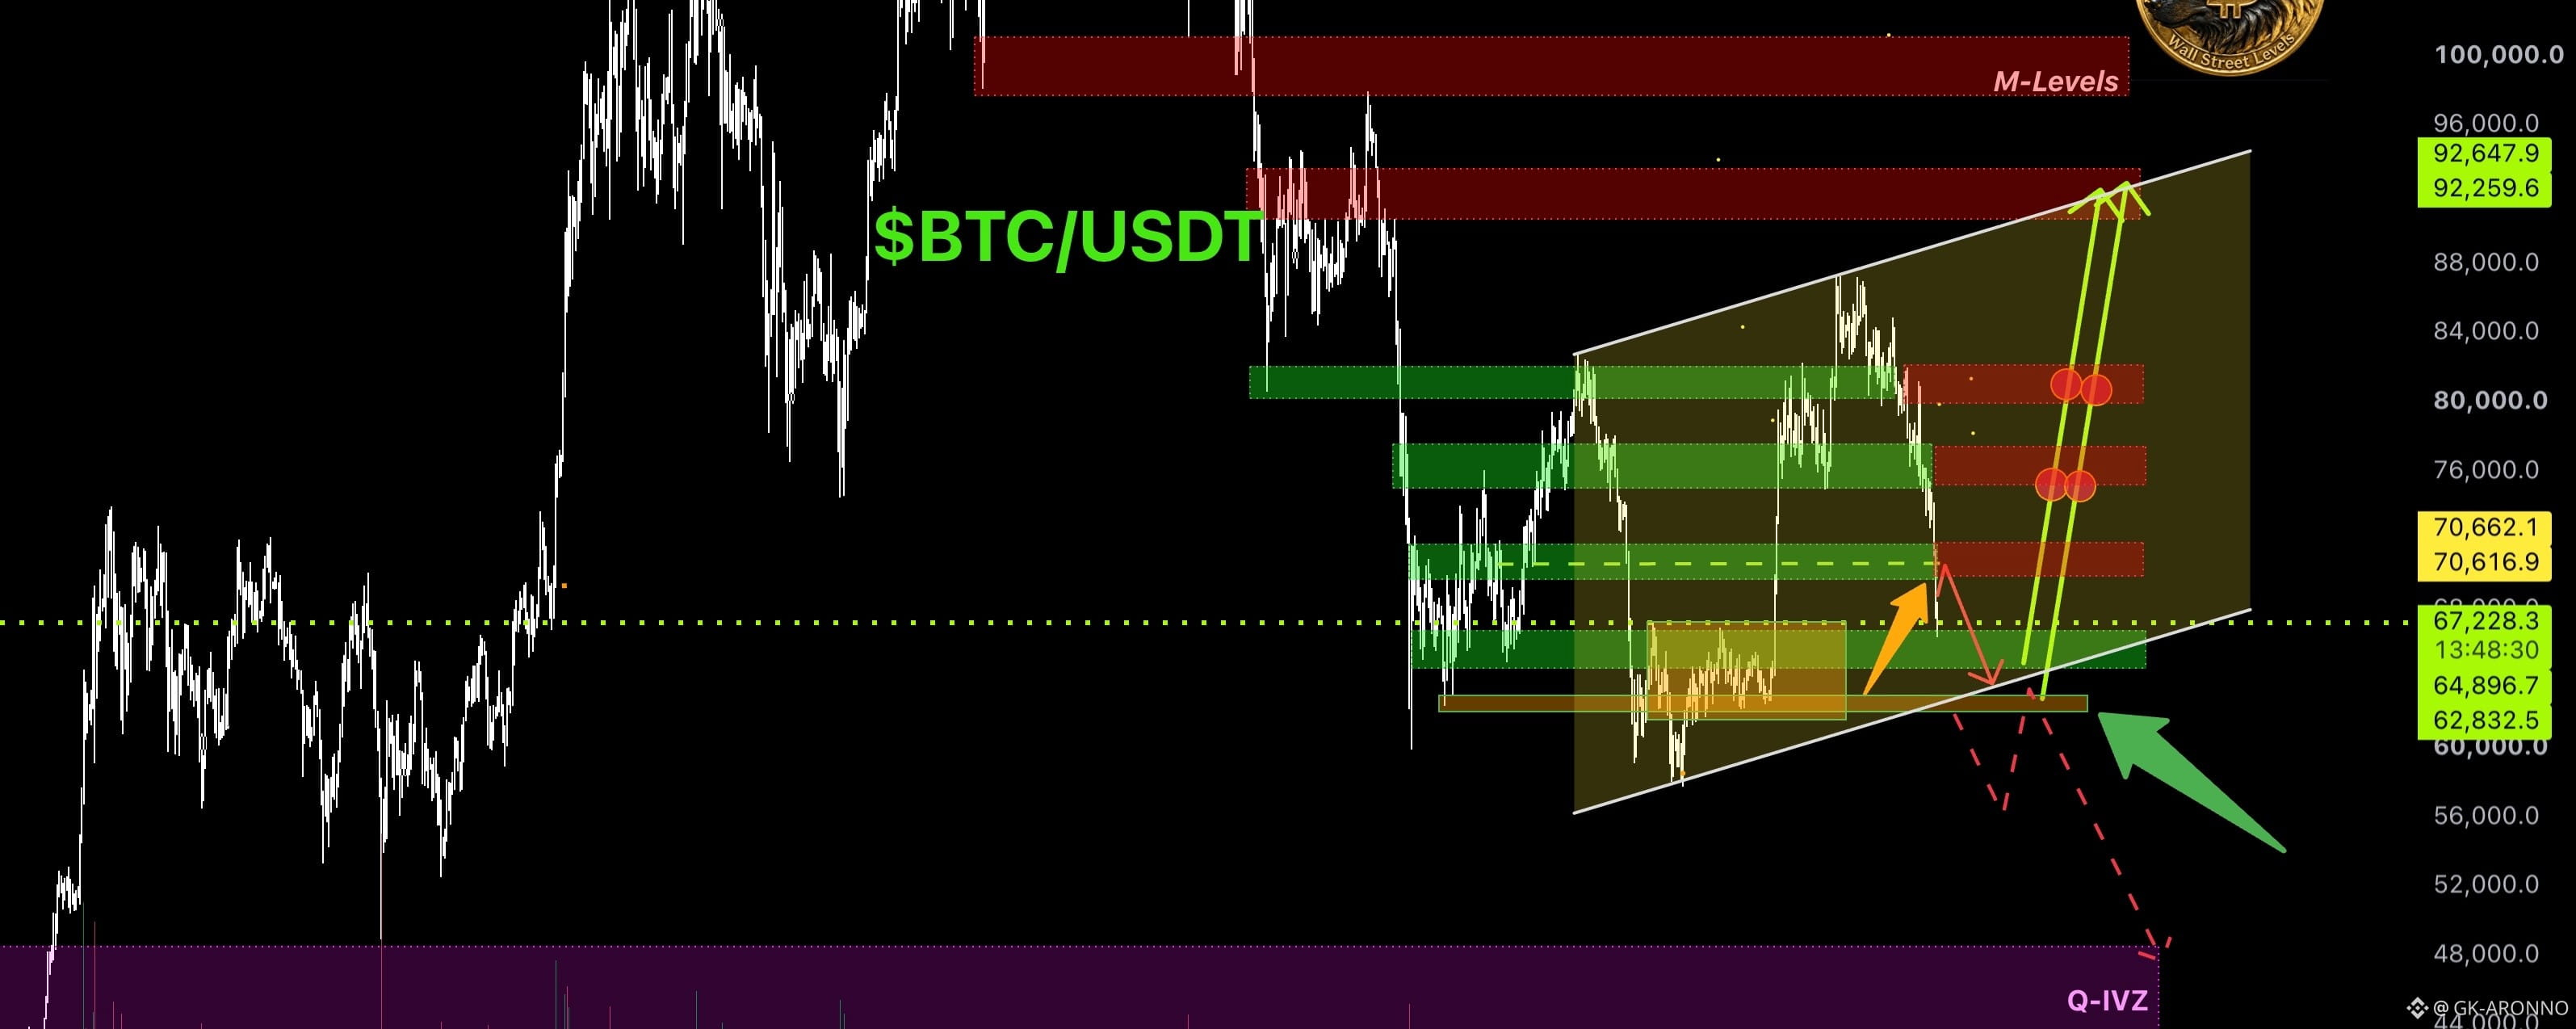
Price tapping the bottom of the ascending channel, lining up with the historical monthly support 📊M-Levels. Needs to hold here to bounce back inside the channel. Breakdown opens the path straight to $48k.
Buyers stepping in right here (orange arrow), but jumping in on this first reaction is a bad risk. Waiting for a deeper drop into the $62000-$66000 zone to catch the long reversal (green arrow), or a clean breakout and hold above $72000.
🟡Trade Plan: Long BTCUSDT
🟢Entry 1: $65300
🟢Entry 2: $63800
🛑Stop: below $62100 (below the range, avoids wick stop-outs)
🎯Target 1: $72000
🎯Target 2: resistance zones above (red 📊M-Levels on the chart)
🤝If the analysis was helpful 💵 — support 🚀.
Analysis based on 🧩IMA (Integrated Market Analysis) and 📊M-Levels — Institutional Interest Level (IIL).
⚠️Important: TA can fail on heavy news — fear and greed drive the price. Watch the news flow and manage risk.