


Market Structure:
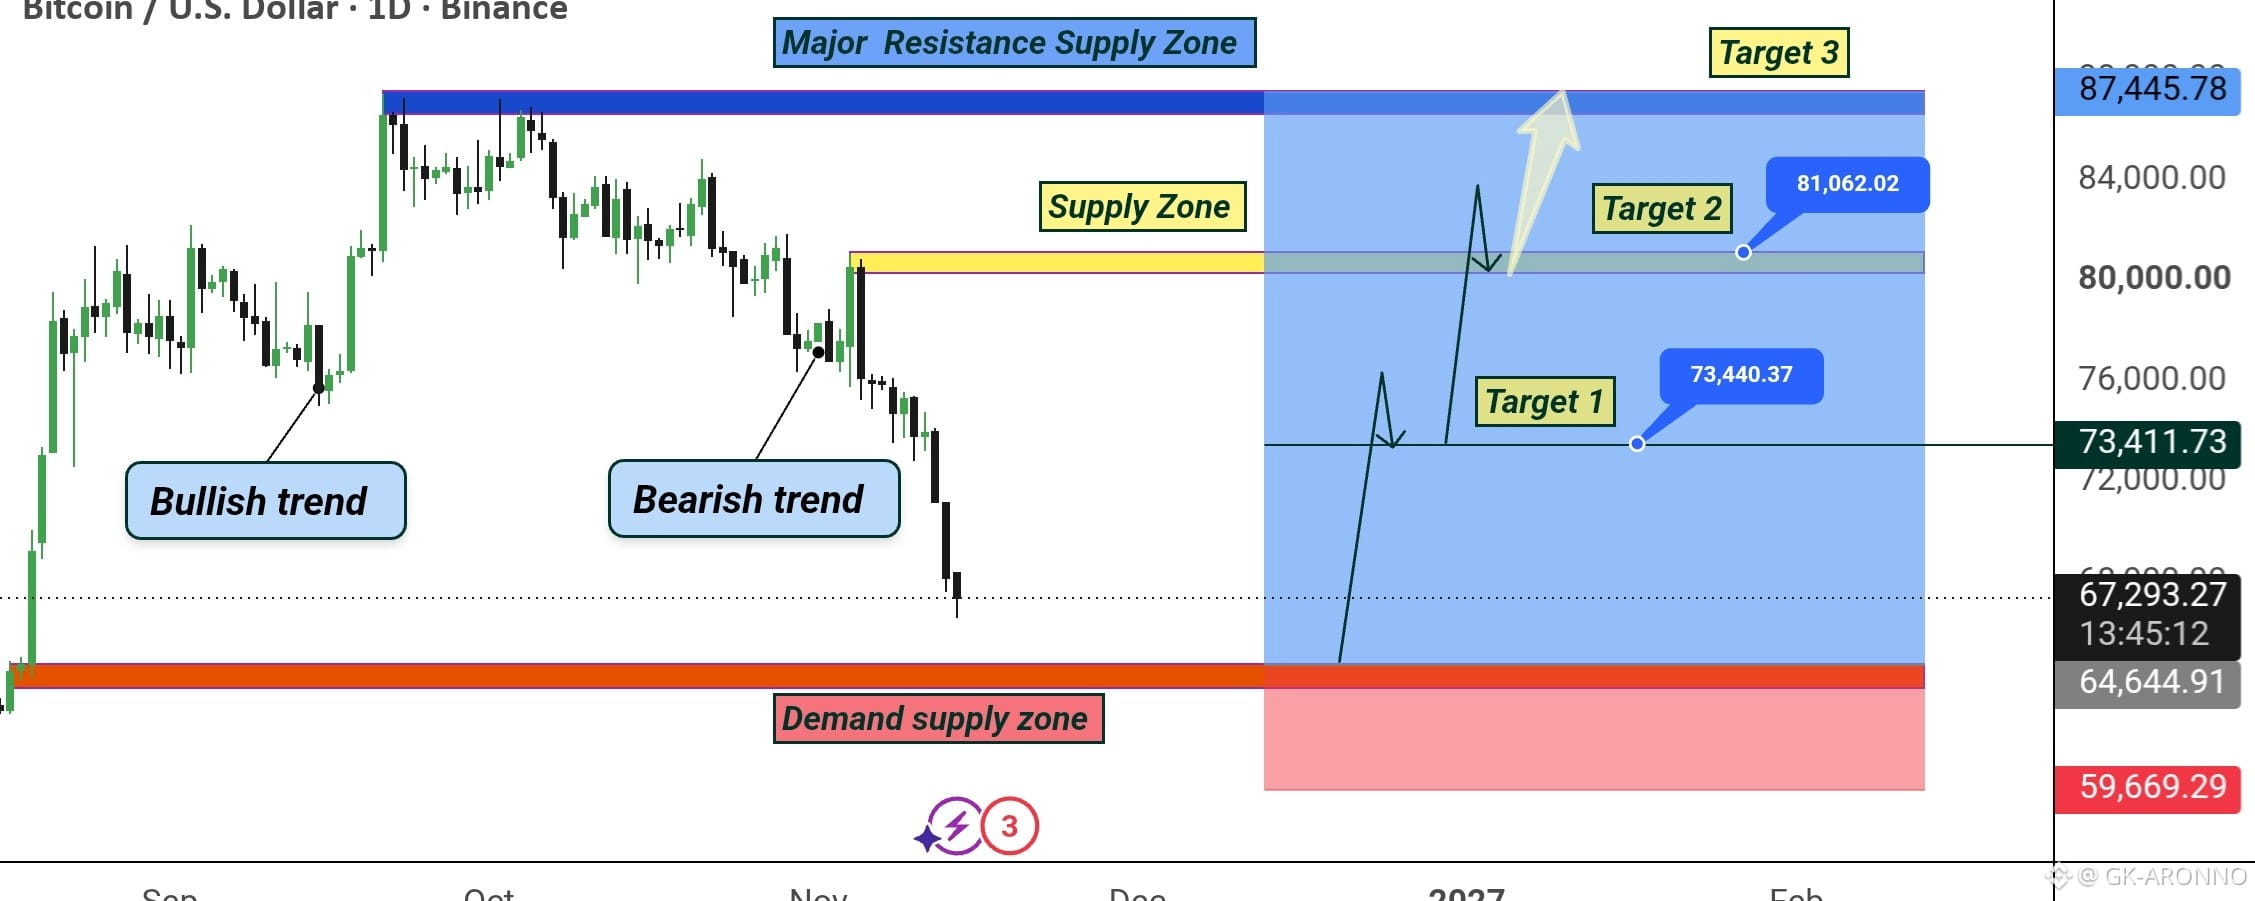
BTCUSD has been moving through a clear transition from a previous bullish trend into a bearish corrective phase. After reaching the major resistance area around 87,000–88,000, price began forming lower highs and lower lows, confirming increasing bearish pressure.
Major Resistance / Supply Zone:
The main resistance and supply area is located around 80,000–82,000. This zone previously acted as a strong rejection area and is an important level to watch if Bitcoin begins a recovery.
Major Resistance Supply Zone:
A higher resistance zone is positioned around 86,000–88,000. This is the major swing-high area. A strong daily breakout and close above this zone would provide stronger confirmation of a broader bullish continuation.
Current Price:
Price is currently around 67,430, following a strong bearish move from the 80K area. The sharp decline has brought BTCUSD directly toward the major demand/support zone.
Demand / Support Zone:
The key demand zone is around 64,500–65,000. This is an important reaction area because previous price action showed strong buying interest from this region. A bullish reaction from this zone could provide the foundation for a recovery.
Bullish Trend:
The earlier price action established a bullish trend with higher highs and higher lows. However, that structure weakened after price failed to maintain the previous highs and started moving downward.
Bearish Trend:
The current short-term structure is bearish. Price has been making lower highs and lower lows, with strong selling pressure pushing BTC toward the demand zone.
Liquidity / Key Level:
The 64,500 area is an important liquidity and reaction level. A sweep below this zone followed by a strong bullish recovery could indicate that sell-side liquidity has been taken before a potential reversal.
Bullish Scenario:
For the buy setup to become stronger, BTC should hold the 64,500–65,000 demand zone, show a clear bullish reaction, and then reclaim nearby resistance levels. Confirmation above the recent bearish structure would strengthen the bullish reversal idea.
Entry Area:
The chart highlights the buy area around the 64,500–67,000 region, with the preferred confirmation being a strong reaction from demand rather than blindly entering during the fall.
Stop-Loss / Invalidation:
The bullish idea becomes invalid if BTC breaks decisively below the major demand zone and continues accepting prices underneath it. The chart's risk area extends toward approximately 59,700–60,000.
Target 1: 🎯 73,440
The first objective is the previous reaction/resistance area around 73,440. This is where some profit could be considered if bullish momentum develops.
Target 2: 🎯 81,062
The second target is around 81,000, aligning with the major supply/resistance region. A move toward this level would represent a significant recovery from the current price.
Target 3: 🎯 87,445
The final target is around 87,445, near the previous major swing high and major resistance supply zone. A sustained move toward this area would complete the larger bullish recovery scenario.
Projected Price Path:
The projected path shows a potential bullish recovery beginning from the demand zone, followed by a move toward 73,440, then a continuation toward 81,062, and finally a possible retest of 87,445. These targets should be treated as potential reaction areas rather than guaranteed outcomes.
Trade Bias: 🟢 Bullish Reversal
Timeframe: 1D Swing Setup
Key Confirmation:
The most important factor is how price reacts around 64,500–65,000. Holding this demand zone and producing bullish confirmation would strengthen the buy scenario. A decisive breakdown below the zone would weaken or invalidate the bullish setup. Setup ready
