$STO: Initiating Volume vs Climax Volume – A Thought Experiment
Why does $STO show a down hour while volume sits above baseline? The question invites a closer look at whether the elevated volume signals the start of a move or the final push before a pause.
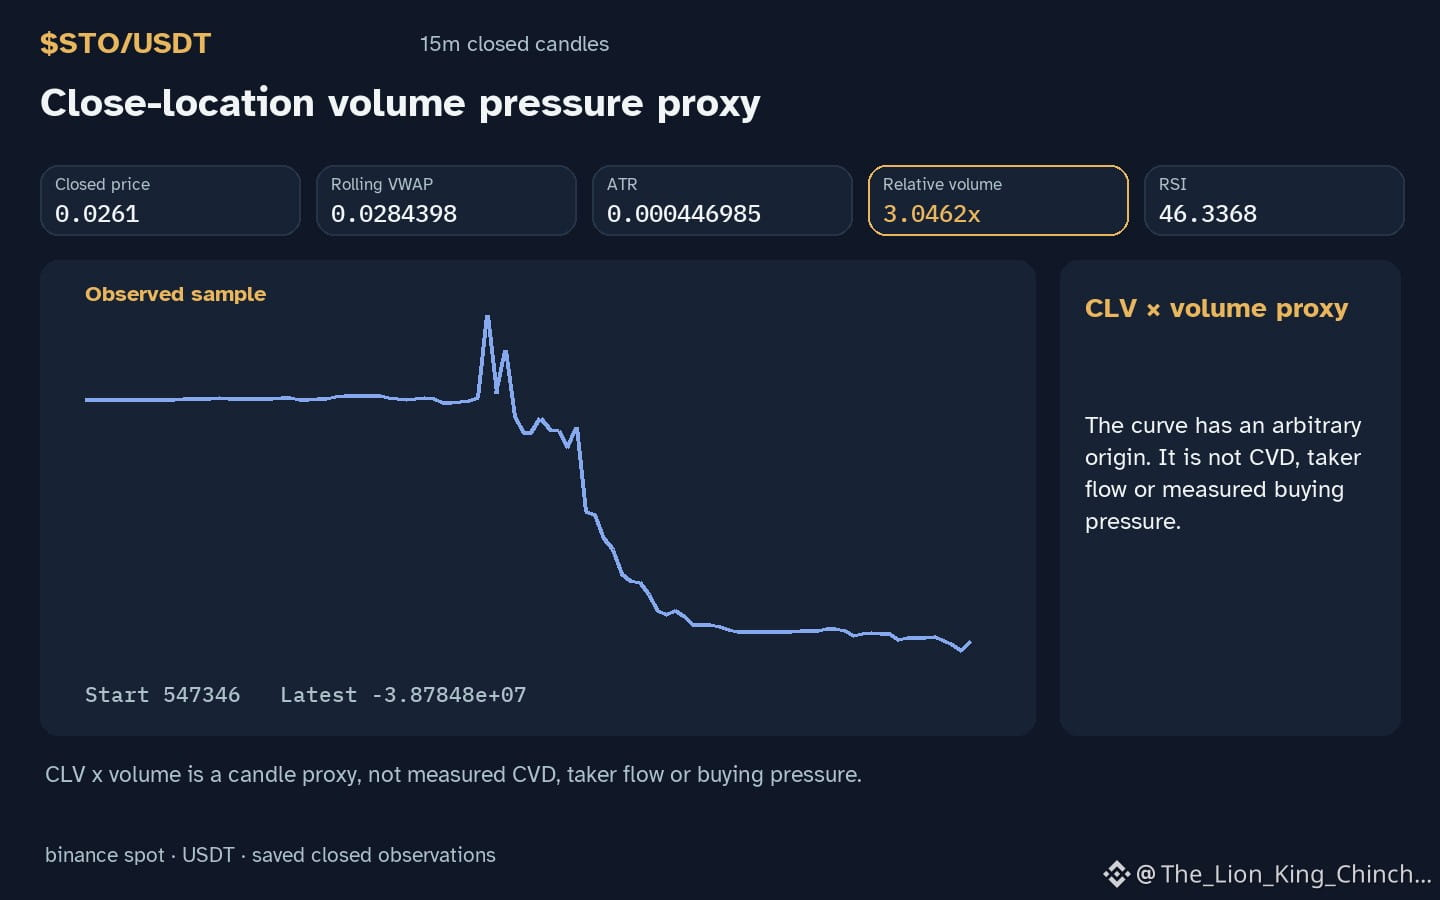
One possible clue is the relative volume reading 3.05x the recent baseline. If this surge appears early in a down trend, it could indicate that new participants are entering the market, reinforcing the direction. In that scenario, the next closed candle confirming the down move would strengthen the initiating‑volume hypothesis.
An alternative reading treats the same volume spike as a climax. When volume spikes near the end of a short‑term decline, it may simply reflect a final burst of trading before liquidity dries up, suggesting a potential reversal or at least a pause. A clean close with little further price movement would support this view.
Both interpretations have limits. The observation does not reveal order‑book depth, so volume alone cannot prove intent. Moreover, the RSI reading 46.3 is neutral, offering no clear overbought or oversold bias.
A counterexample would be a subsequent candle that opens with low volume and moves opposite to the prior direction; that would weaken the initiating‑volume case. Conversely, if the next candle closes sharply lower with still elevated volume, the climax‑volume reading loses weight.
To reassess, monitor the next hourly candle: if it closes lower and volume remains above baseline, the initiating view gains credibility; if volume falls back to baseline while price stabilises, the climax hypothesis becomes more plausible.
Probabilistic market research, not a recommendation or guaranteed return.
#STO #MarketAnalysis #CryptoLearning
Why does $STO show a down hour while volume sits above baseline? The question invites a closer look at whether the elevated volume signals the start of a move or the final push before a pause.
One possible clue is the relative volume reading 3.05x the recent baseline. If this surge appears early in a down trend, it could indicate that new participants are entering the market, reinforcing the direction. In that scenario, the next closed candle confirming the down move would strengthen the initiating‑volume hypothesis.
An alternative reading treats the same volume spike as a climax. When volume spikes near the end of a short‑term decline, it may simply reflect a final burst of trading before liquidity dries up, suggesting a potential reversal or at least a pause. A clean close with little further price movement would support this view.
Both interpretations have limits. The observation does not reveal order‑book depth, so volume alone cannot prove intent. Moreover, the RSI reading 46.3 is neutral, offering no clear overbought or oversold bias.
A counterexample would be a subsequent candle that opens with low volume and moves opposite to the prior direction; that would weaken the initiating‑volume case. Conversely, if the next candle closes sharply lower with still elevated volume, the climax‑volume reading loses weight.
To reassess, monitor the next hourly candle: if it closes lower and volume remains above baseline, the initiating view gains credibility; if volume falls back to baseline while price stabilises, the climax hypothesis becomes more plausible.
Probabilistic market research, not a recommendation or guaranteed return.
#STO #MarketAnalysis #CryptoLearning