⚡ $SOXSB Surges 13.45% — Is the Semiconductor Selloff Creating Another Opportunity? 📊
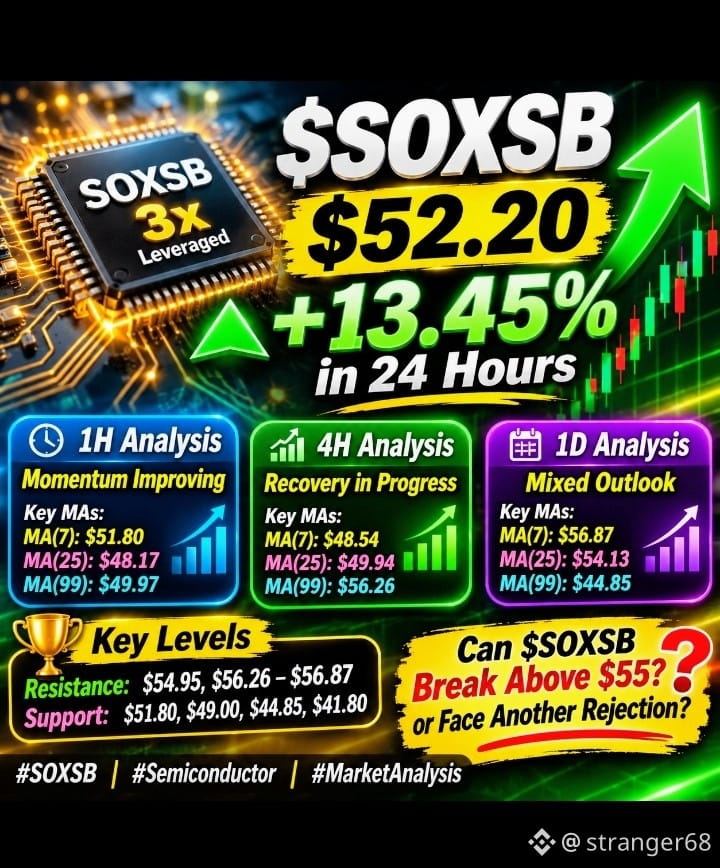
🔥 A powerful rebound is putting $SOXSB back in the spotlight at $52.20, up 13.45% in 24 hours. After recovering from $41.80, buyers pushed the price toward $54.95. Volume has picked up considerably, suggesting renewed trading activity. But can this recovery overcome the next resistance zone? 🚀
📈 1H Chart: Short-term momentum is improving. Price at $52.20 is holding above MA(7) at $51.80, MA(25) at $48.17 and MA(99) at $49.97. Holding above $51.80 could support another attempt toward $54.95. ⚡
🔥 4H Chart: The rebound has lifted price above MA(7) at $48.54 and MA(25) at $49.94. However, MA(99) at $56.26 remains overhead resistance. A sustained move above $54.95 would strengthen the recovery signal. 📊
🌍 1D Chart: The bigger picture remains mixed. Price is still below MA(7) at $56.87 and MA(25) at $54.13, but remains above MA(99) at $44.85. Reclaiming the $54–$57 region could improve the daily structure, while losing $44.85 would weaken the rebound. 🛡️
🎯 Key Levels to Watch:
- Resistance: $54.95, $56.26–$56.87
- Support: $51.80, $49.00, $44.85, $41.80
⚠️ Remember, SOXS is a leveraged inverse semiconductor ETF designed for 3x daily exposure. Its returns and risks can behave differently over longer holding periods. ⚠️
🤔 Can $SOXSB break above $55 and extend this rally, or are sellers preparing another rejection? 📉
#SOXSB #Semiconductor #MarketAnalysis
#WhatWillDriveCryptoandStocks’NextRebound? #Anthropic’s6xIPODemandSignalsPotentialRecordRaise #BitcoinBreaksBelow200WeekMovingAverage #USPPIMissMayEaseBTCPressure
🔥 A powerful rebound is putting $SOXSB back in the spotlight at $52.20, up 13.45% in 24 hours. After recovering from $41.80, buyers pushed the price toward $54.95. Volume has picked up considerably, suggesting renewed trading activity. But can this recovery overcome the next resistance zone? 🚀
📈 1H Chart: Short-term momentum is improving. Price at $52.20 is holding above MA(7) at $51.80, MA(25) at $48.17 and MA(99) at $49.97. Holding above $51.80 could support another attempt toward $54.95. ⚡
🔥 4H Chart: The rebound has lifted price above MA(7) at $48.54 and MA(25) at $49.94. However, MA(99) at $56.26 remains overhead resistance. A sustained move above $54.95 would strengthen the recovery signal. 📊
🌍 1D Chart: The bigger picture remains mixed. Price is still below MA(7) at $56.87 and MA(25) at $54.13, but remains above MA(99) at $44.85. Reclaiming the $54–$57 region could improve the daily structure, while losing $44.85 would weaken the rebound. 🛡️
🎯 Key Levels to Watch:
- Resistance: $54.95, $56.26–$56.87
- Support: $51.80, $49.00, $44.85, $41.80
⚠️ Remember, SOXS is a leveraged inverse semiconductor ETF designed for 3x daily exposure. Its returns and risks can behave differently over longer holding periods. ⚠️
🤔 Can $SOXSB break above $55 and extend this rally, or are sellers preparing another rejection? 📉
#SOXSB #Semiconductor #MarketAnalysis
#WhatWillDriveCryptoandStocks’NextRebound? #Anthropic’s6xIPODemandSignalsPotentialRecordRaise #BitcoinBreaksBelow200WeekMovingAverage #USPPIMissMayEaseBTCPressure