DAILY SIGNAL — SOL/USDT
Date: 14 Nov 2026
Chart Time: 03:06 UTC+8
Timeframe: 1m
Intraday Bias: Bearish impulse → recovery → consolidation below resistance
---
📊 MARKET BIAS
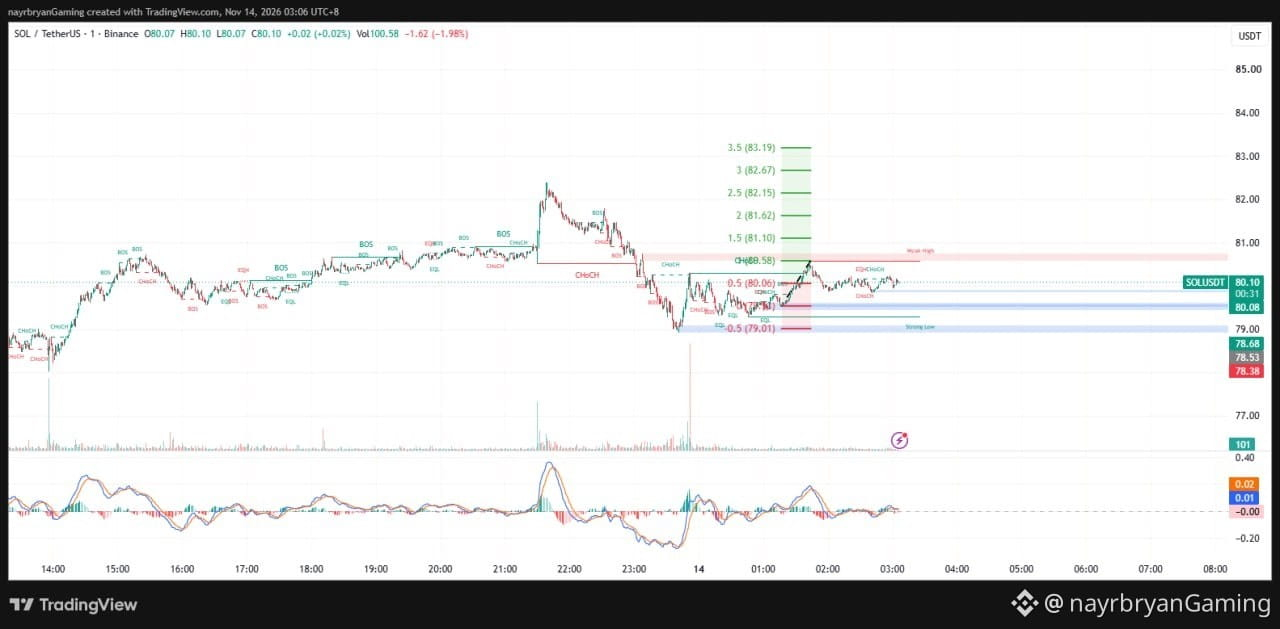
SOL is currently trading around 80.10 after experiencing a significant bearish move from the previous high near 82.30.
Following the sharp decline, buyers managed to generate a recovery from the lower demand region around 79.00.
However, the recovery has encountered resistance near the 80.58–80.80 supply area.
Price is currently consolidating around 80.10, suggesting that the market is attempting to establish short-term balance after the previous volatility.
The immediate direction depends on whether buyers can reclaim the upper resistance area or sellers regain control and push price toward lower demand.
A confirmed bullish breakout could expose the Fibonacci extensions toward 81.10 → 81.62 → 82.15.
Conversely, rejection around resistance followed by a breakdown of nearby support could expose the 79.50 and 79.01 regions.
---
🔹 KEY LEVELS FROM CHART
Current Price:
80.10
Immediate Fibonacci Reference:
80.06
Immediate Resistance:
80.58
Major Supply Zone:
80.58–80.80
Weak-High Reference:
Approximately 80.80
Intermediate Support:
Around 79.50
Major Demand Reference:
79.01
Lower Support:
78.68–78.53
Additional Lower Reference:
78.38
---
🎯 FIBONACCI LEVELS
Upside Extensions:
TP1 → 80.58 (1.0 Fib)
TP2 → 81.10 (1.5 Fib)
TP3 → 81.62 (2.0 Fib)
TP4 → 82.15 (2.5 Fib)
TP5 → 82.67 (3.0 Fib)
TP6 → 83.19 (3.5 Fib)
Downside References:
80.06 (0.5 Fib)
79.50 (intermediate structural reference)
79.01 (-0.5 Fib)
Lower Chart References:
78.68 → 78.53 → 78.38
---
🧠 QUICK INSIGHT
"After a strong sell-off, recovery is only the beginning. Confirmation determines whether the market is reversing or simply retracing."
---
⚠️ DISCLAIMER
This is personal market analysis, not financial advice.
This chart framework is for educational purposes only.
Always DYOR / DYODD, manage risk properly, and avoid emotional trading.
— @nayrbryanGaming
#SOL #SOLUSDT #Crypto #Trading
Date: 14 Nov 2026
Chart Time: 03:06 UTC+8
Timeframe: 1m
Intraday Bias: Bearish impulse → recovery → consolidation below resistance
---
📊 MARKET BIAS
SOL is currently trading around 80.10 after experiencing a significant bearish move from the previous high near 82.30.
Following the sharp decline, buyers managed to generate a recovery from the lower demand region around 79.00.
However, the recovery has encountered resistance near the 80.58–80.80 supply area.
Price is currently consolidating around 80.10, suggesting that the market is attempting to establish short-term balance after the previous volatility.
The immediate direction depends on whether buyers can reclaim the upper resistance area or sellers regain control and push price toward lower demand.
A confirmed bullish breakout could expose the Fibonacci extensions toward 81.10 → 81.62 → 82.15.
Conversely, rejection around resistance followed by a breakdown of nearby support could expose the 79.50 and 79.01 regions.
---
🔹 KEY LEVELS FROM CHART
Current Price:
80.10
Immediate Fibonacci Reference:
80.06
Immediate Resistance:
80.58
Major Supply Zone:
80.58–80.80
Weak-High Reference:
Approximately 80.80
Intermediate Support:
Around 79.50
Major Demand Reference:
79.01
Lower Support:
78.68–78.53
Additional Lower Reference:
78.38
---
🎯 FIBONACCI LEVELS
Upside Extensions:
TP1 → 80.58 (1.0 Fib)
TP2 → 81.10 (1.5 Fib)
TP3 → 81.62 (2.0 Fib)
TP4 → 82.15 (2.5 Fib)
TP5 → 82.67 (3.0 Fib)
TP6 → 83.19 (3.5 Fib)
Downside References:
80.06 (0.5 Fib)
79.50 (intermediate structural reference)
79.01 (-0.5 Fib)
Lower Chart References:
78.68 → 78.53 → 78.38
---
🧠 QUICK INSIGHT
"After a strong sell-off, recovery is only the beginning. Confirmation determines whether the market is reversing or simply retracing."
---
⚠️ DISCLAIMER
This is personal market analysis, not financial advice.
This chart framework is for educational purposes only.
Always DYOR / DYODD, manage risk properly, and avoid emotional trading.
— @nayrbryanGaming
#SOL #SOLUSDT #Crypto #Trading