

Bitcoin just dipped below $69,000 for the first time since mid-August, catching many traders off guard. This sudden pullback has pushed BTC right onto its 200-week moving average—the exact technical level that anchored its summer recovery.
Rather than a single black swan event, five separate macro, institutional, and technical pressures collided in the same week to drive this selloff. Here is a breakdown of what is happening right now:
1. Tech & AI Market Contagion
Global tech equities took a sharp hit following the unexpected resignation of Nvidia CEO Jensen Huang. Because Bitcoin often trades in correlation with high-growth tech and AI stocks during periods of market stress, the sudden wave of risk-off selling in equities quickly spilled over into crypto.
2. Hotter-Than-Expected U.S. Inflation
The latest U.S. Consumer Price Index (CPI) report came in hotter than forecasted at 0.4%. Sticky inflation strengthens the U.S. dollar and dims hopes for aggressive Federal Reserve rate cuts, prompting institutional investors to pull back from riskier assets.
3. Over $1 Billion in Leverage Liquidations
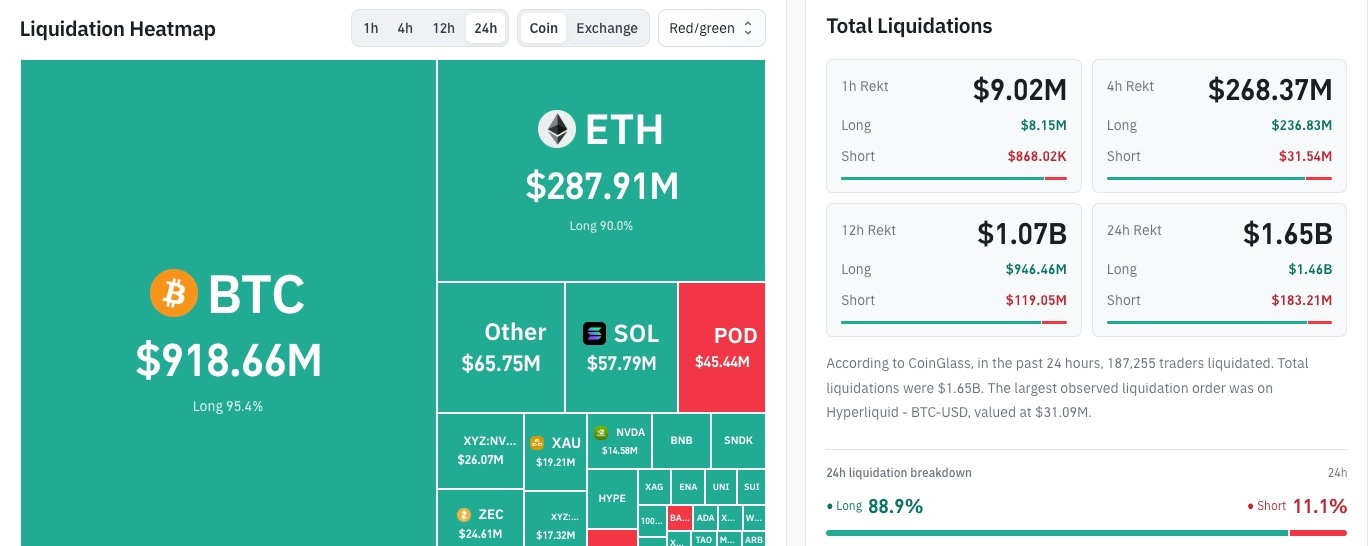
Once Bitcoin lost the key $70,000 psychological support level, a cascade of forced liquidations hit the derivatives market. Over $1 billion in leveraged positions—mostly over-extended longs—were wiped out within 24 hours, accelerating the downward momentum.
4. Tightening Liquidity & ETF Outflows
Market liquidity has noticeably thinned out. Persistent net outflows from U.S. spot Bitcoin ETFs, paired with a $14.2 billion contraction in total stablecoin supply over the past 30 days, show that fresh capital is temporarily sitting on the sidelines.
5. MSCI Index Exclusions for Crypto Treasuries
Index provider MSCI announced that public Bitcoin treasury companies, including Strategy and Metaplanet, will be removed from benchmark equity indexes at the end of November. This news sparked concerns about forced passive selling and future capital-raising hurdles for major corporate BTC buyers.
What’s Next for BTC?
With the Crypto Fear & Greed Index deep in Extreme Fear territory, all eyes are on the 200-week moving average.
Bullish Case: If buyers defend this historic support zone, it could mark a classic cycle higher-low and spark a relief bounce back above $70K.
Bearish Case: A clean weekly close below this trendline could open the door for a deeper liquidity sweep before the next leg up.
What is your game plan right now? Are you buying the dip at the 200-week average, or waiting for confirmation?
#Bitcoin #WhatWillDriveCryptoandStocks’NextRebound? #Anthropic’s6xIPODemandSignalsPotentialRecordRaise #AnthropicRejectsIPODelayValuationinQuestion