$NBISB : Live Auction Analogy for Breakout Candles
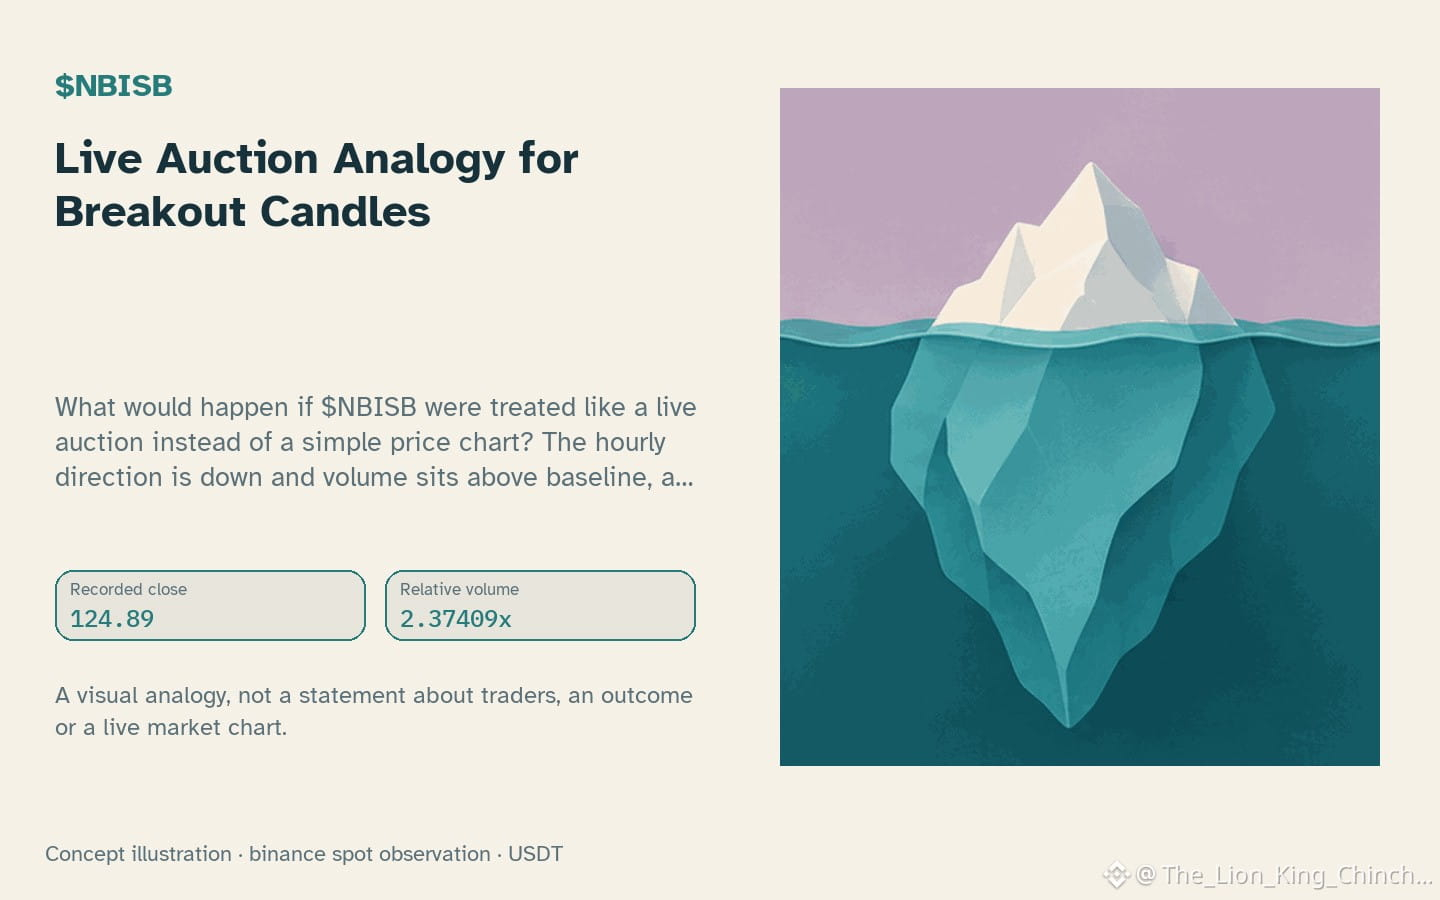
What would happen if $NBISB were treated like a live auction instead of a simple price chart? The hourly direction is down and volume sits above baseline, a situation that invites a thought experiment rather than a prediction.\n\nImagine a gallery auction where each bid must exceed the previous one by a fixed increment. When a painting finally sells for a high price, the winning bidder often pays more than the intrinsic value because the competitive pressure forces rapid escalation. Translating this to crypto, a candle that breaks a recent resistance level can be seen as a "hammer" that triggers a flurry of market orders, each trying to out‑bid the last. The surge in relative volume 2.37x acts like a crowd of bidders arriving at the same moment, pushing the price upward regardless of the underlying liquidity.\n\nThe analogy helps explain why a breakout candle may appear strong even when the underlying order book is thin. However, it fails when the market has deep limit‑order walls that absorb the buying pressure, much like a reserve price that stops an auction early. In that case the price may revert quickly, and the breakout loses credibility.\n\nA useful way to reassess the auction hypothesis is to watch the next closed candle: if the price holds above the breakout level with sustained relative volume and a neutral RSI 32.8, the auction‑like momentum gains support; if the candle closes back below the level, the analogy loses explanatory power. 🤔
Probabilistic market research, not a recommendation or guaranteed return.
#NBISB #CryptoEducation #CryptoLearning
What would happen if $NBISB were treated like a live auction instead of a simple price chart? The hourly direction is down and volume sits above baseline, a situation that invites a thought experiment rather than a prediction.\n\nImagine a gallery auction where each bid must exceed the previous one by a fixed increment. When a painting finally sells for a high price, the winning bidder often pays more than the intrinsic value because the competitive pressure forces rapid escalation. Translating this to crypto, a candle that breaks a recent resistance level can be seen as a "hammer" that triggers a flurry of market orders, each trying to out‑bid the last. The surge in relative volume 2.37x acts like a crowd of bidders arriving at the same moment, pushing the price upward regardless of the underlying liquidity.\n\nThe analogy helps explain why a breakout candle may appear strong even when the underlying order book is thin. However, it fails when the market has deep limit‑order walls that absorb the buying pressure, much like a reserve price that stops an auction early. In that case the price may revert quickly, and the breakout loses credibility.\n\nA useful way to reassess the auction hypothesis is to watch the next closed candle: if the price holds above the breakout level with sustained relative volume and a neutral RSI 32.8, the auction‑like momentum gains support; if the candle closes back below the level, the analogy loses explanatory power. 🤔
Probabilistic market research, not a recommendation or guaranteed return.
#NBISB #CryptoEducation #CryptoLearning