$XUSD: Volume Timing: Initiating Burst or Ending Surge?
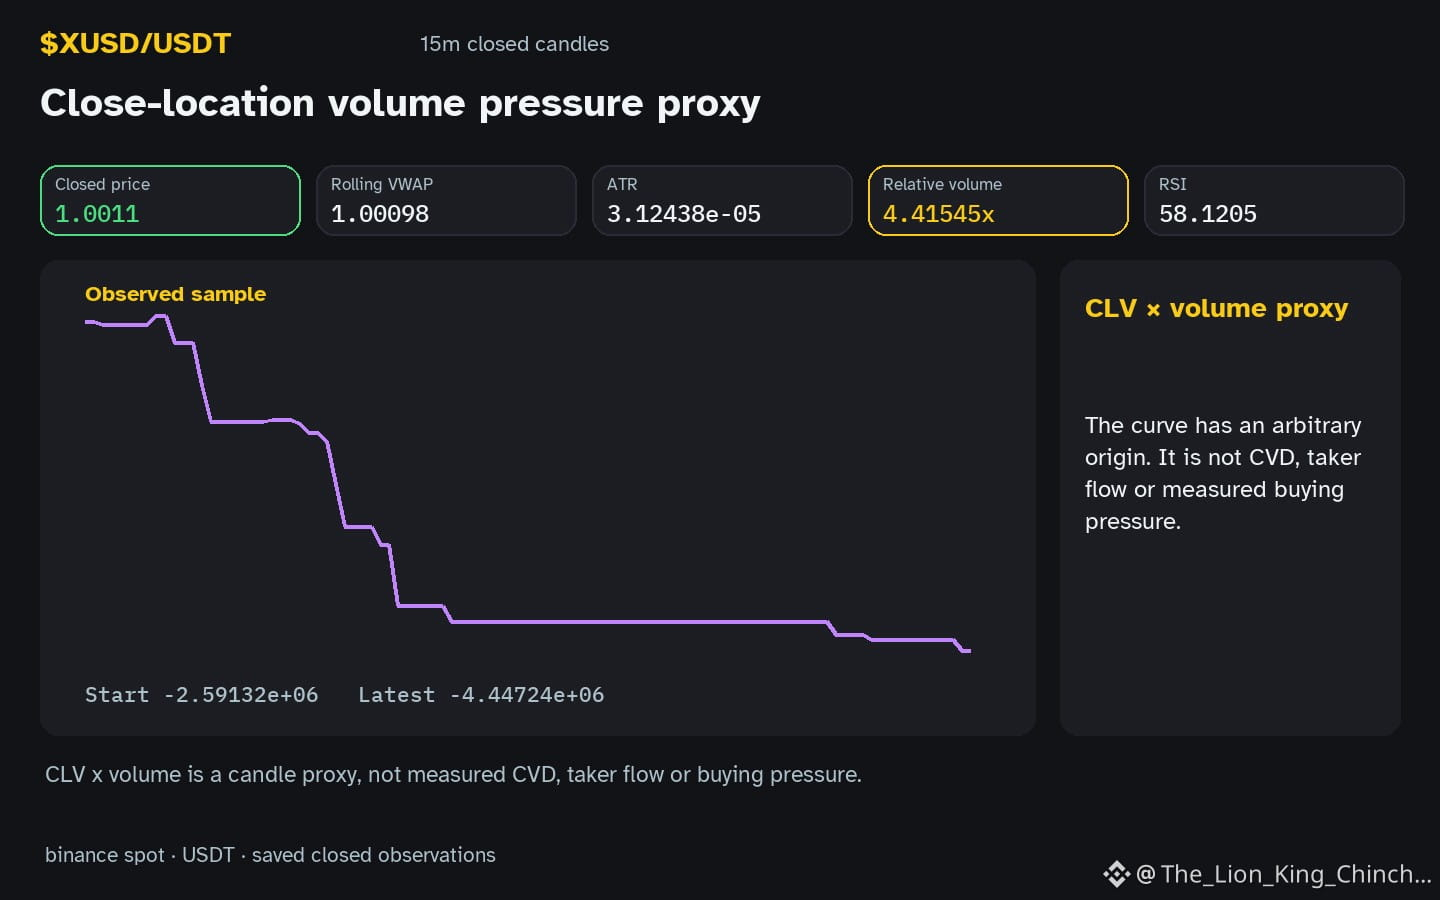
What does the recent rise in 4.42x baseline volume tell us about the shape of the current move for $XUSD? The observation notes a flat hourly direction while volume sits above baseline, prompting a question of whether this is an initiating pulse or a climax that could precede a clean close.
One possible clue is that high baseline‑adjusted volume early in a price swing often signals fresh participation and can precede a continuation. In that scenario the flat direction may simply reflect a short pause before the next leg, and a subsequent candle that closes cleanly would reinforce the initiating‑volume hypothesis.
An alternative reading treats the same volume as a climax. When volume spikes near the end of a range, it may represent the last round of buying or selling before participants step back. Here a retest of the local support or resistance would be the confirming signal, and a clean close could instead indicate that the climax hypothesis was wrong.
Each interpretation has a weakening condition. For the initiating view, a future candle that closes with a narrow range and low volume would suggest the earlier spike was not a true start. For the climax view, a candle that closes strongly in the direction of the prior move with continued elevated volume would diminish the retest argument.
A concrete next step is to watch the next closed hourly candle. If it shows a modest price shift and volume returns to baseline, the initiating‑volume reading loses weight. Conversely, if the candle extends the move and volume stays high, the climax hypothesis becomes less plausible. This simple reassessment keeps the analysis grounded in the current observation while leaving room for future evidence to shift the perspective.
Probabilistic market research, not a recommendation or guaranteed return.
#XUSD #MarketAnalysis #CryptoLearning
What does the recent rise in 4.42x baseline volume tell us about the shape of the current move for $XUSD? The observation notes a flat hourly direction while volume sits above baseline, prompting a question of whether this is an initiating pulse or a climax that could precede a clean close.
One possible clue is that high baseline‑adjusted volume early in a price swing often signals fresh participation and can precede a continuation. In that scenario the flat direction may simply reflect a short pause before the next leg, and a subsequent candle that closes cleanly would reinforce the initiating‑volume hypothesis.
An alternative reading treats the same volume as a climax. When volume spikes near the end of a range, it may represent the last round of buying or selling before participants step back. Here a retest of the local support or resistance would be the confirming signal, and a clean close could instead indicate that the climax hypothesis was wrong.
Each interpretation has a weakening condition. For the initiating view, a future candle that closes with a narrow range and low volume would suggest the earlier spike was not a true start. For the climax view, a candle that closes strongly in the direction of the prior move with continued elevated volume would diminish the retest argument.
A concrete next step is to watch the next closed hourly candle. If it shows a modest price shift and volume returns to baseline, the initiating‑volume reading loses weight. Conversely, if the candle extends the move and volume stays high, the climax hypothesis becomes less plausible. This simple reassessment keeps the analysis grounded in the current observation while leaving room for future evidence to shift the perspective.
Probabilistic market research, not a recommendation or guaranteed return.
#XUSD #MarketAnalysis #CryptoLearning