$NVDAB : Evaluating Fractional Units Over Sticker Prices
The local price for $NVDAB shows an up hourly direction while remaining inside the recorded range. A common habit involves staring at the ticker list until the digits blur, trying to decide if a high-priced asset is somehow less affordable than one priced in pennies.
This hypothetical research habit often masks a simple lesson about fractional ownership. In many digital markets, the unit price is an arbitrary divisor. If an asset trades at 160.74, the ability to purchase a small fraction means the total cost of entry is actually determined by your budget, not the price of a single whole unit. A high unit price does not inherently limit a small account any more than a low unit price guarantees more growth.
Consider the daily change -6.59539% as a thought experiment. A ten percent move on a small fraction of one $NVDAB yields the same mathematical result as a ten percent move on thousands of low-priced tokens of equal total value. The primary difference is often just the decimal placement.
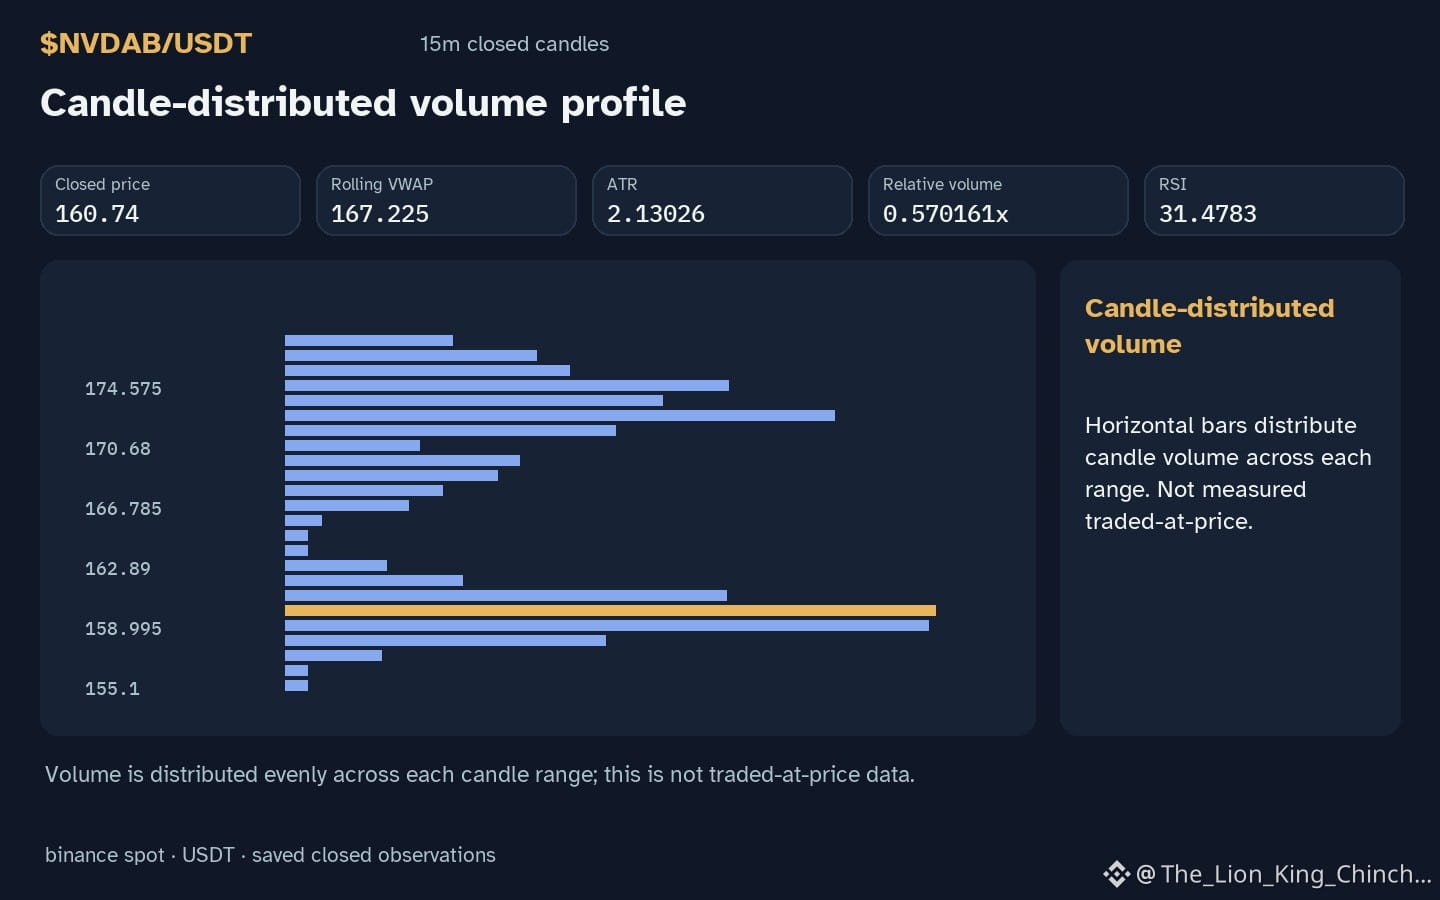
One concrete observation is that volume is currently not above baseline. Relative volume sits at 0.57x, suggesting that current activity is mirroring typical levels rather than a spike. If a future closed candle breaches the resistance of 175.4 on high relative volume, it might suggest the range is shifting, yet the fractional math remains constant. Reassessing based on percentage volatility instead of unit price helps align expectations with reality.
Probabilistic market research, not a recommendation or guaranteed return.
Have you changed the rule after seeing the candle?
#NVDAB #LearnCrypto #CryptoLearning
The local price for $NVDAB shows an up hourly direction while remaining inside the recorded range. A common habit involves staring at the ticker list until the digits blur, trying to decide if a high-priced asset is somehow less affordable than one priced in pennies.
This hypothetical research habit often masks a simple lesson about fractional ownership. In many digital markets, the unit price is an arbitrary divisor. If an asset trades at 160.74, the ability to purchase a small fraction means the total cost of entry is actually determined by your budget, not the price of a single whole unit. A high unit price does not inherently limit a small account any more than a low unit price guarantees more growth.
Consider the daily change -6.59539% as a thought experiment. A ten percent move on a small fraction of one $NVDAB yields the same mathematical result as a ten percent move on thousands of low-priced tokens of equal total value. The primary difference is often just the decimal placement.
One concrete observation is that volume is currently not above baseline. Relative volume sits at 0.57x, suggesting that current activity is mirroring typical levels rather than a spike. If a future closed candle breaches the resistance of 175.4 on high relative volume, it might suggest the range is shifting, yet the fractional math remains constant. Reassessing based on percentage volatility instead of unit price helps align expectations with reality.
Probabilistic market research, not a recommendation or guaranteed return.
Have you changed the rule after seeing the candle?
#NVDAB #LearnCrypto #CryptoLearning