


$ETH /USD Complete Analysis — 12 November 2026
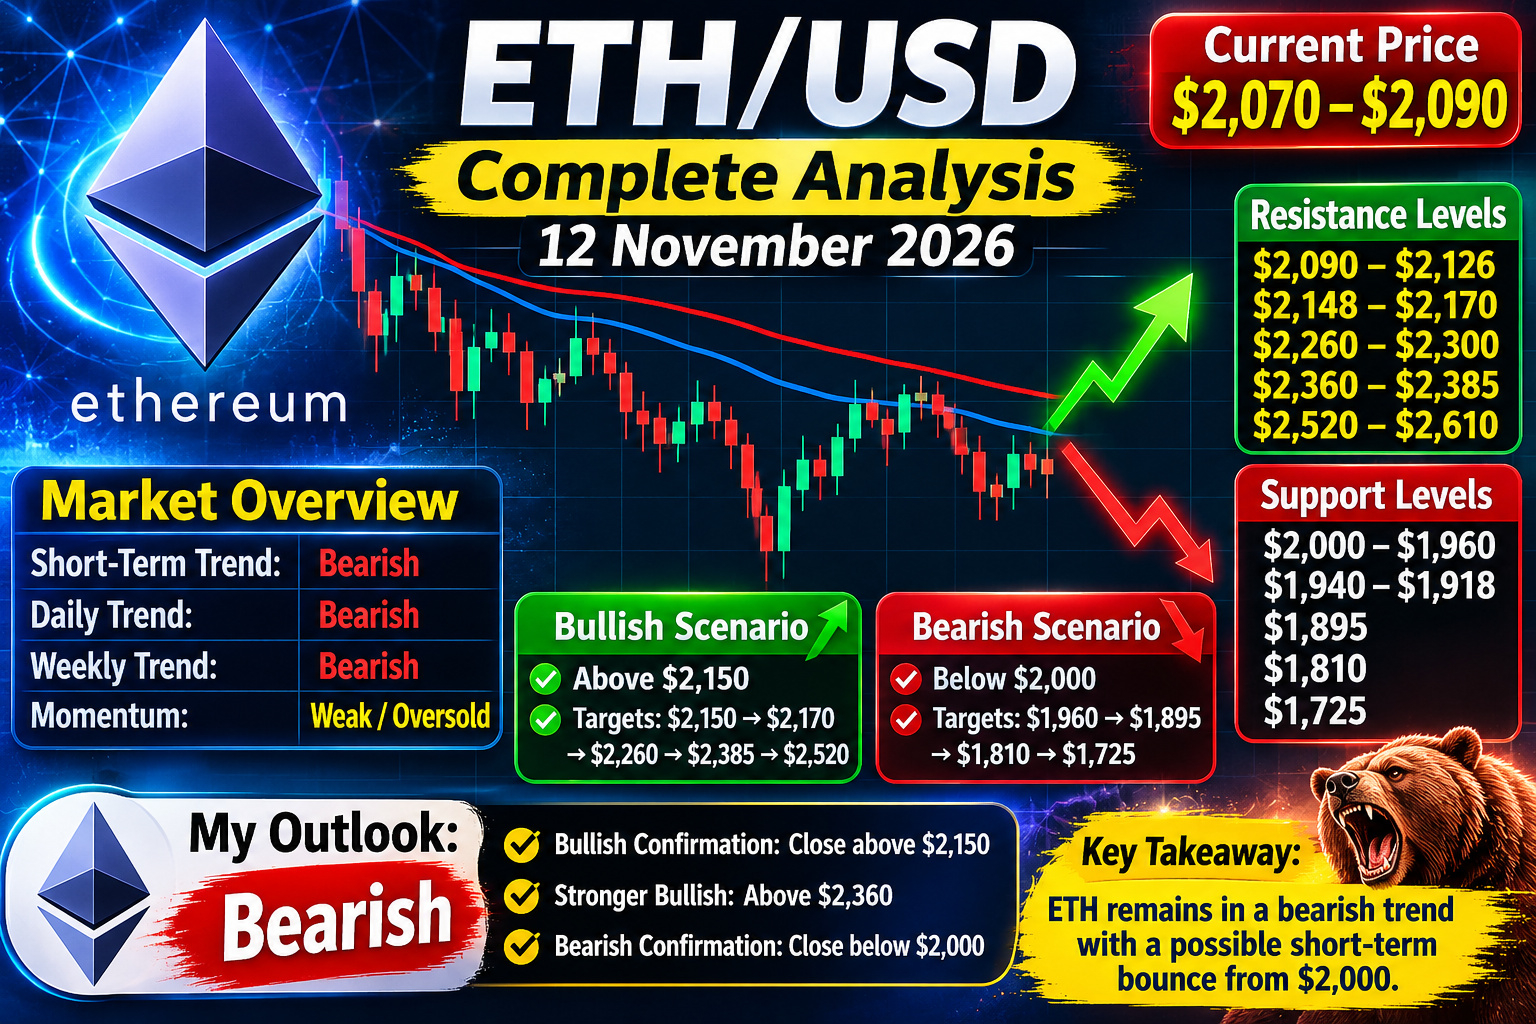
Current $ETH /USD: around $2,070–$2,090. ETH is in a strong short-term downtrend, with price below its major moving averages and momentum still weak.

📊 Market Structure
Timeframe Bias
15m–4H 🔴 Bearish
Daily 🔴 Bearish
Weekly 🔴 Bearish
Momentum Weak / near oversold
Overall 🔴 Bearish
$ETH is trading below its 20-day average (~$2,257), 50-day average (~$2,442) and 200-day average (~$2,385). Daily RSI is around 32, indicating significant selling pressure and approaching oversold territory.
🔑 Key Support Levels
- $2,000–$1,960 — immediate/critical support
- $1,940–$1,918 — next support zone
- $1,895 — major technical support
- $1,810 — deeper downside target
- $1,725 — major bearish extension
A daily close below $2,000 would be a particularly negative signal and could accelerate the move toward $1,950 and $1,895.
🚧 Resistance Levels
- $2,090–$2,126 — immediate resistance
- $2,148 — next resistance
- $2,170 — important recovery level
- $2,260–$2,300 — major resistance/EMA zone
- $2,360–$2,385 — major trend resistance
- $2,520–$2,610 — higher resistance zone
The daily technical pivot is around $2,364, with the bearish structure remaining intact while ETH stays below that area.
🟢 Bullish Scenario
ETH needs to first reclaim $2,126–$2,150.
A stronger recovery would require:
$2,150 → $2,170 → $2,260 → $2,385 → $2,520
A daily close above approximately $2,360–$2,385 would significantly improve the medium-term structure and challenge the current bearish trend.
🔴 Bearish Scenario
If ETH fails to hold $2,000, watch:
$1,960 → $1,940 → $1,895 → $1,810
A decisive daily breakdown below $1,895 would expose approximately $1,810, with $1,725 as a deeper downside level.
📉 Momentum & Indicators
- RSI: ~32 — weak and approaching oversold
- MACD: bearish, below signal line
- 20-day average: ~$2,257
- 50-day average: ~$2,442
- 200-day average: ~$2,385
- Bollinger position: price near the lower band
The combination of falling averages and bearish MACD favors sellers, although the low RSI means a short-term relief bounce is possible.
🎯 My ETH/USD Outlook
Current bias: 🔴 Bearish
Bullish confirmation: Daily close above $2,150, stronger confirmation above $2,360–$2,385
Bearish confirmation: Daily close below $2,000
Bullish targets:
➡️ $2,150 → $2,170 → $2,260 → $2,385 → $2,520
Bearish targets:
➡️ $1,960 → $1,895 → $1,810 → $1,725
Bottom line: ETH is currently in a bearish trend with oversold characteristics. A bounce from $2,000–$1,960 is possible, but I would consider the trend genuinely improving only after ETH reclaims $2,150, and preferably $2,360+. Until then, rallies can face selling pressure.
This is technical market analysis, not financial advice. Crypto trading, especially leverage, carries substantial risk.
#Ethereum #ETHUSDT #ETHUSDTANALYSIS #TrendingTopic #viralpost