

SOL Technical Outlook: Solana Faces Strong Selling Pressure as RSI Enters Oversold Territory
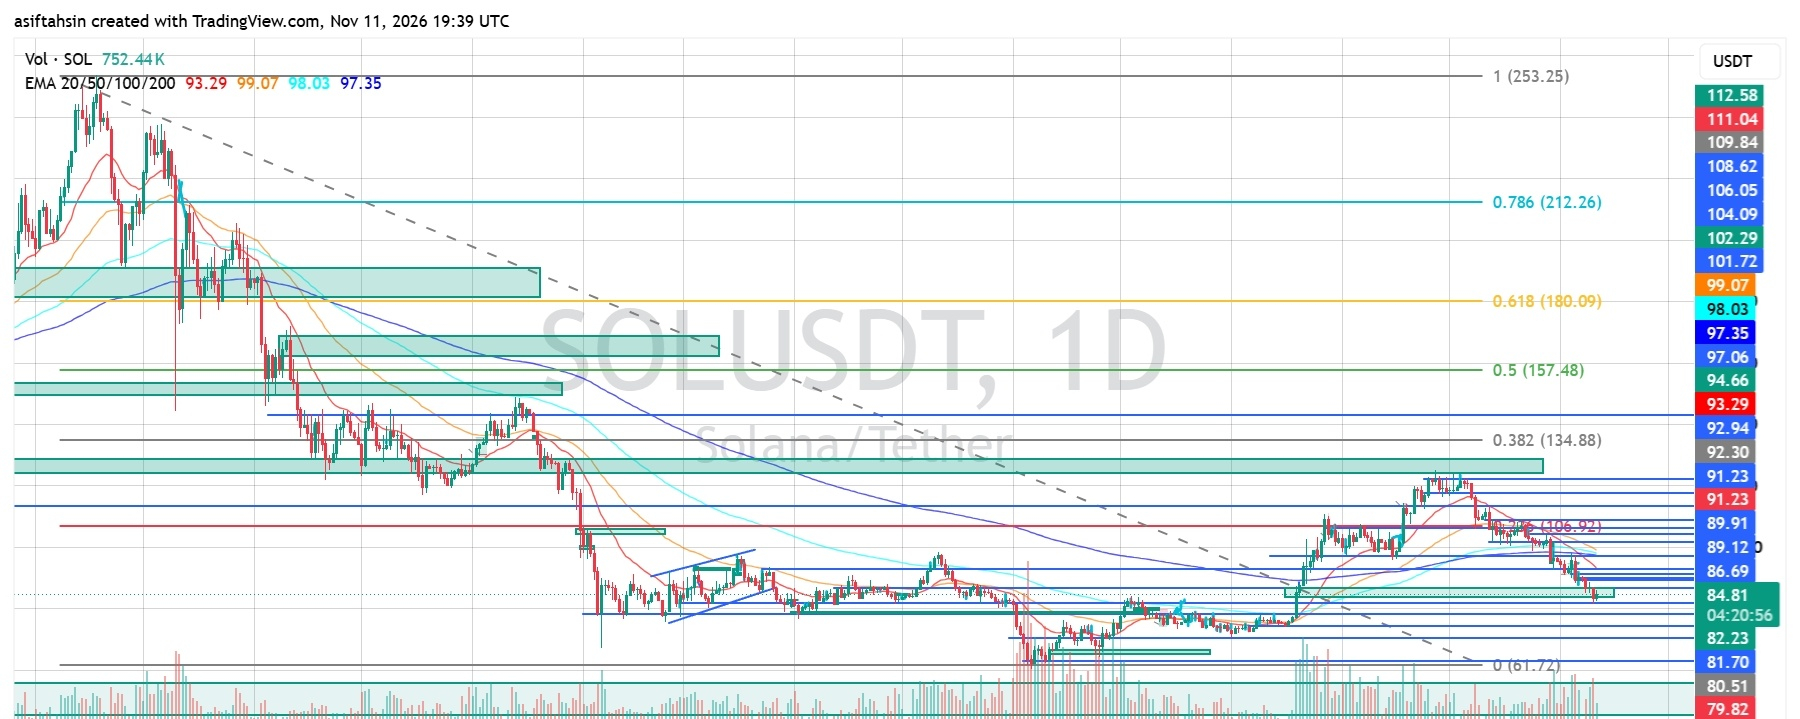
Solana (SOL) is trading around $84.82, following a sustained decline from its recent October recovery high near the $92–$93 region. The price has now fallen below all four major EMAs, indicating that sellers remain in control of the daily trend.
SOL is approaching an important support area around $82.23–$81.70. Although momentum is deeply oversold, a confirmed recovery above nearby resistance is needed before considering a meaningful bullish reversal.
EMA Structure (Bearish Trend)
SOL is trading below all four major exponential moving averages:
- 20 EMA: $93.29
- 50 EMA: $99.07
- 100 EMA: $98.03
- 200 EMA: $97.35
The 20 EMA is below the longer-term averages, while price remains significantly below the entire EMA cluster.
This structure reflects strong bearish momentum. The $89.12–$93.29 region is the first major recovery hurdle, followed by the broader $97–$99 EMA resistance zone.
Fibonacci Levels
The chart's broader Fibonacci structure highlights these major levels:
- 0.236: approximately $104.09
- 0.382: $134.88
- 0.5: $157.48
- 0.618: $180.09
- 0.786: $212.26
These are higher-timeframe reference levels. SOL needs to reclaim its nearby resistance zones before these broader Fibonacci targets become relevant.
Bullish Recovery Scenario
SOL is showing oversold momentum, which could create room for a short-term relief bounce.
For buyers to regain control, the price needs to reclaim:
- $86.69 – First resistance
- $89.12–$89.91 – Near-term recovery zone
- $91.23–$92.94 – Stronger resistance
- $93.29 – 20 EMA
A sustained move above $93.29 could open the door toward $97.35–$99.07, where the major EMA cluster may act as resistance.
Bearish Continuation Scenario
If SOL fails to recover and sellers maintain pressure, the next downside areas to monitor are:
- $82.23–$81.70 – Immediate support zone
- $80.51 – Next support
- $79.82–$79.06 – Additional demand area
- $78.26 – Lower support reference
A decisive daily close below $78.26 would increase the risk of a deeper decline toward the broader $61.72 Fibonacci swing-low region.
RSI Momentum
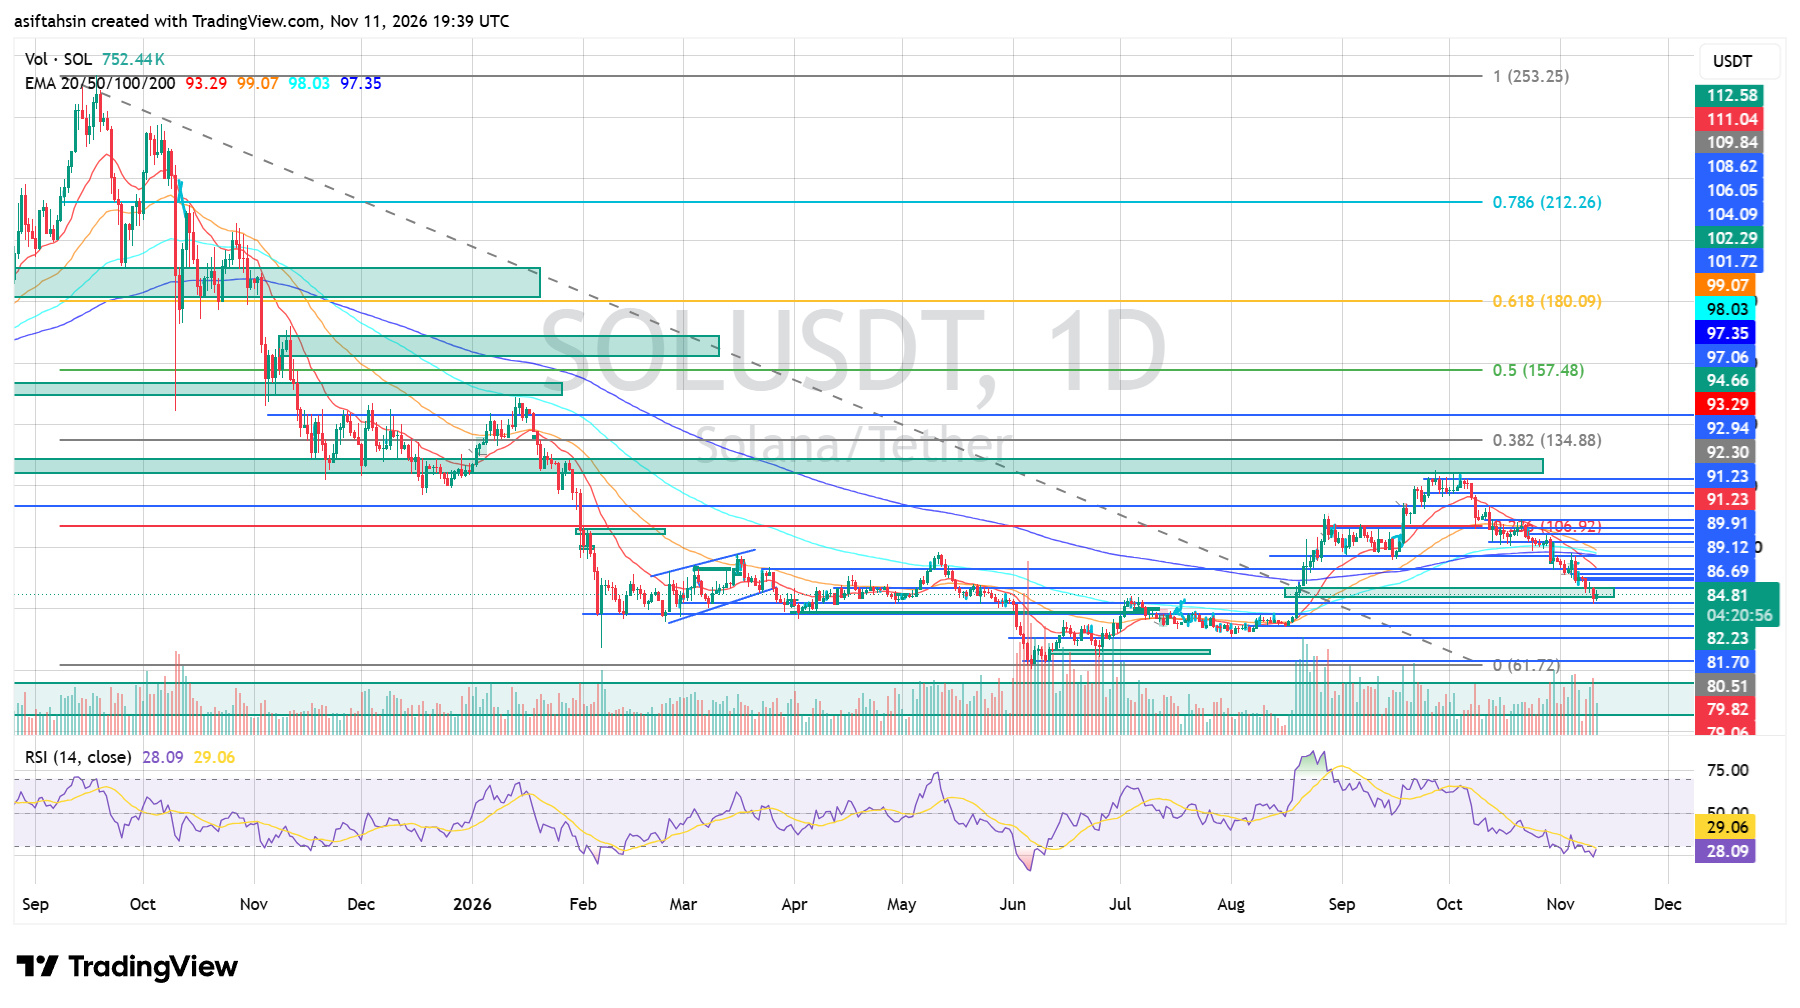
The daily RSI is currently around 28.09, with its signal line near 29.06.
This places SOL in oversold territory, showing that selling pressure has become intense. A rebound is possible, but oversold conditions alone do not confirm a trend reversal.
A recovery above the RSI 30 level, followed by improving price structure, would provide an early sign of momentum stabilization.
Market Structure & Trend
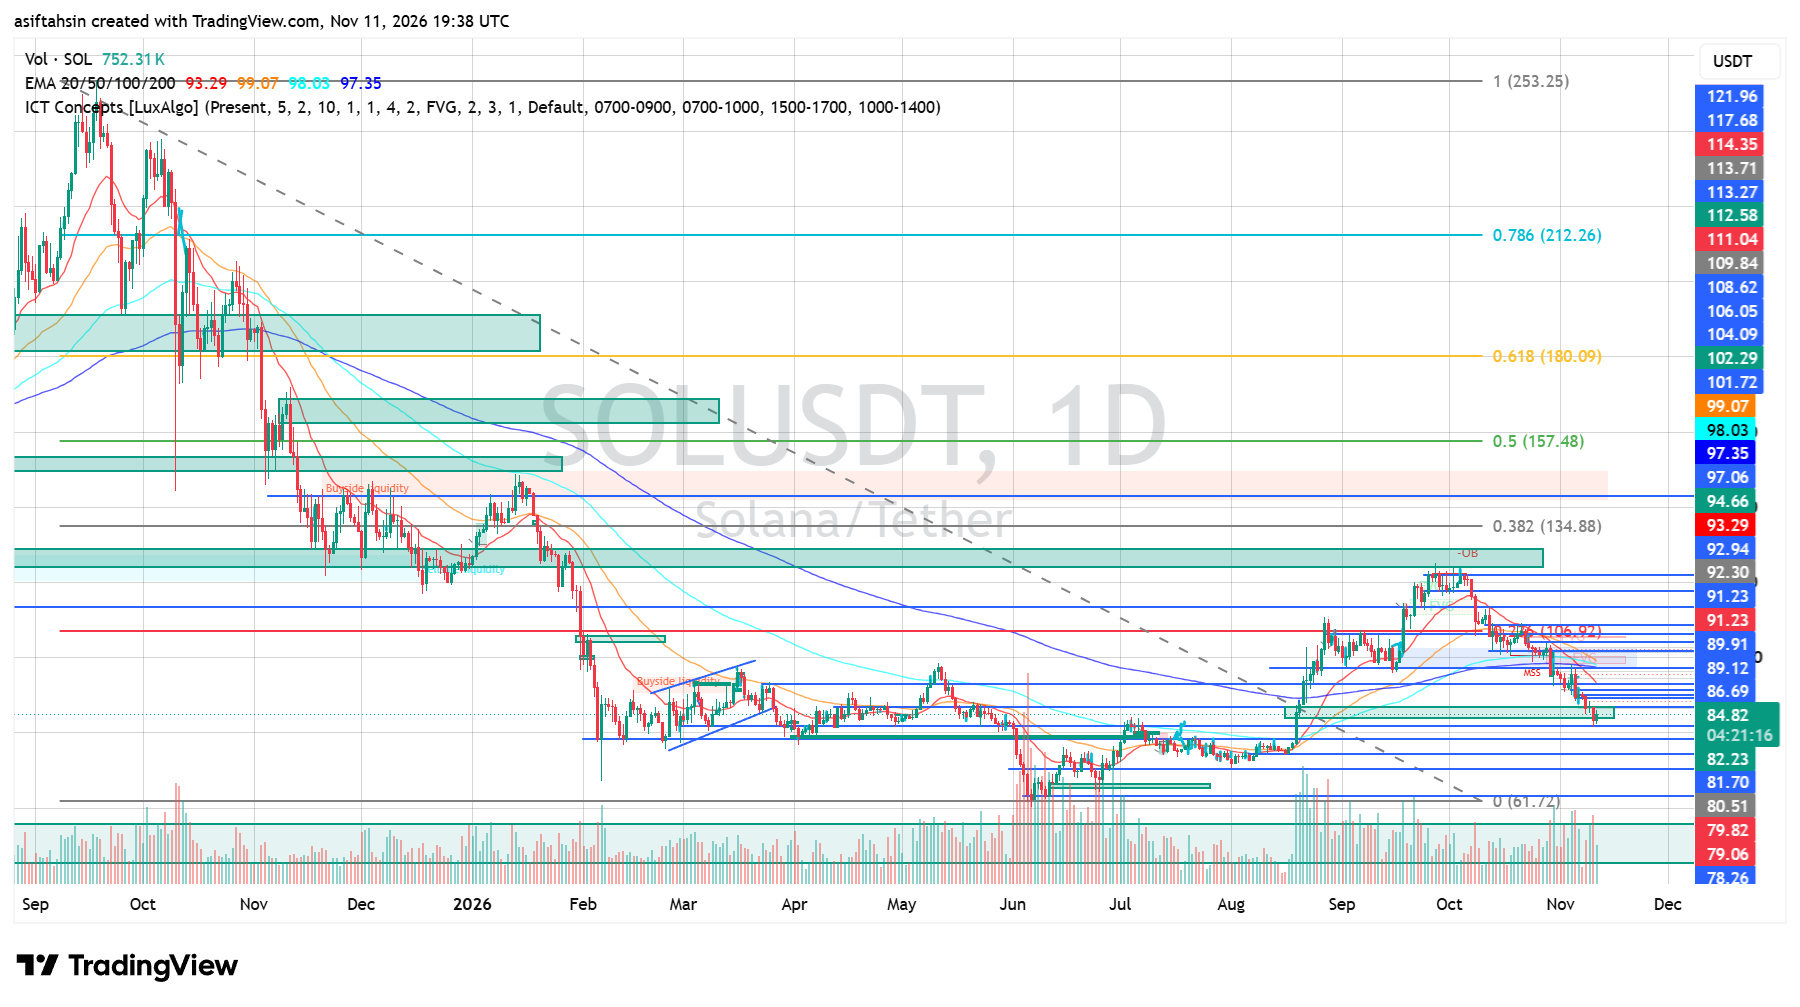
SOL previously recovered from its summer lows and advanced toward the $92–$93 resistance region. However, the recent rejection has produced a sequence of lower prices, with the market now trading below all major EMAs.
The immediate focus is whether buyers can defend the $82.23–$81.70 support area. Holding this zone could allow a relief bounce, while a breakdown would strengthen the bearish continuation scenario.
Important Price Levels
Resistance:
- $86.69
- $89.12–$89.91
- $91.23–$92.94
- $93.29
- $97.35–$99.07
Support:
- $82.23–$81.70
- $80.51
- $79.82–$79.06
- $78.26
- $61.72 – Broader swing-low reference
Final Outlook
SOL remains bearish on the daily timeframe while trading below the $93.29–$99.07 EMA resistance cluster.
The RSI near 28 suggests the possibility of a short-term relief bounce, but buyers must reclaim $89.12–$93.29 to improve the recovery outlook.
If support around $82.23–$81.70 fails, further downside toward $80.51 and $78.26 becomes increasingly likely.
Current Bias: Bearish | Oversold conditions may trigger a relief bounce, but trend reversal is not confirmed.
