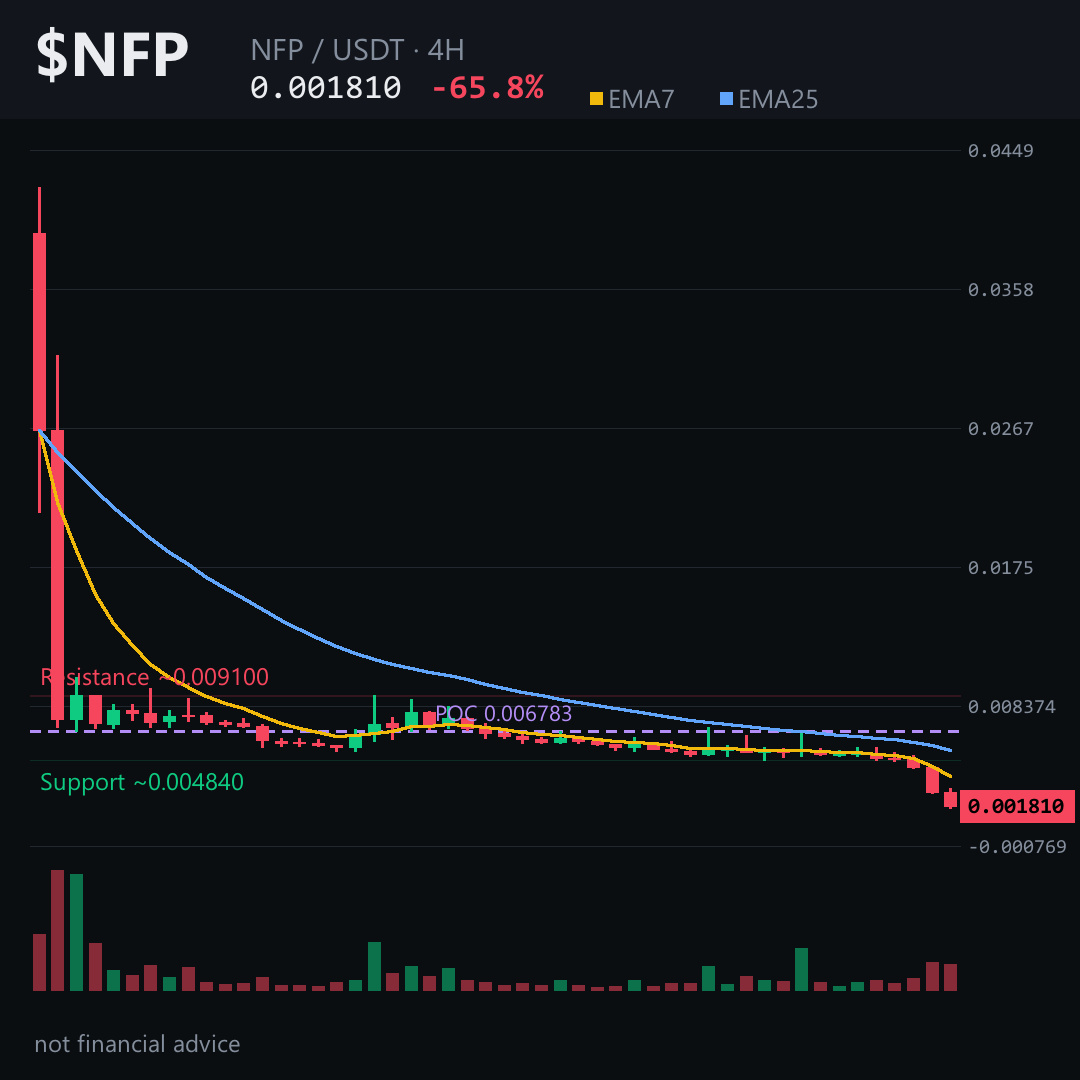
The 4‑hour candle just slipped under the ~0.00191 ceiling and kept sliding.
If you missed that breach, you’re already watching the wrong side of the move 👇
Price is deep in the 12‑point RSI abyss, EMA7 is flat‑lined beneath EMA25, and the volume profile’s point‑of‑control sits well above today’s price. All signs point to more downside, but a sudden pop above the stop‑zone would flip the script.
On the 4H chart the key zones line up like this: the current area hovers around 0.00182, the invalidation line sits near 0.00191 — a close above it would invalidate the bearish bias — and the objective zone sits down around 0.00166. Tap $NFP to pull up the chart and see these levels yourself.
My read: the market is screaming lower; the real risk is a bounce that punches through the ~0.00191 barrier.
Follow me for the next update if $NFP finally breaks that level — I’ll break down what it means for the next leg.
What’s your take on $NFP around the 0.0019 area? 👇
⚠️ Not financial advice. DYOR.
#NFP #Crypto #BinanceSquare #TopLoser
If you missed that breach, you’re already watching the wrong side of the move 👇
Price is deep in the 12‑point RSI abyss, EMA7 is flat‑lined beneath EMA25, and the volume profile’s point‑of‑control sits well above today’s price. All signs point to more downside, but a sudden pop above the stop‑zone would flip the script.
On the 4H chart the key zones line up like this: the current area hovers around 0.00182, the invalidation line sits near 0.00191 — a close above it would invalidate the bearish bias — and the objective zone sits down around 0.00166. Tap $NFP to pull up the chart and see these levels yourself.
My read: the market is screaming lower; the real risk is a bounce that punches through the ~0.00191 barrier.
Follow me for the next update if $NFP finally breaks that level — I’ll break down what it means for the next leg.
What’s your take on $NFP around the 0.0019 area? 👇
⚠️ Not financial advice. DYOR.
#NFP #Crypto #BinanceSquare #TopLoser