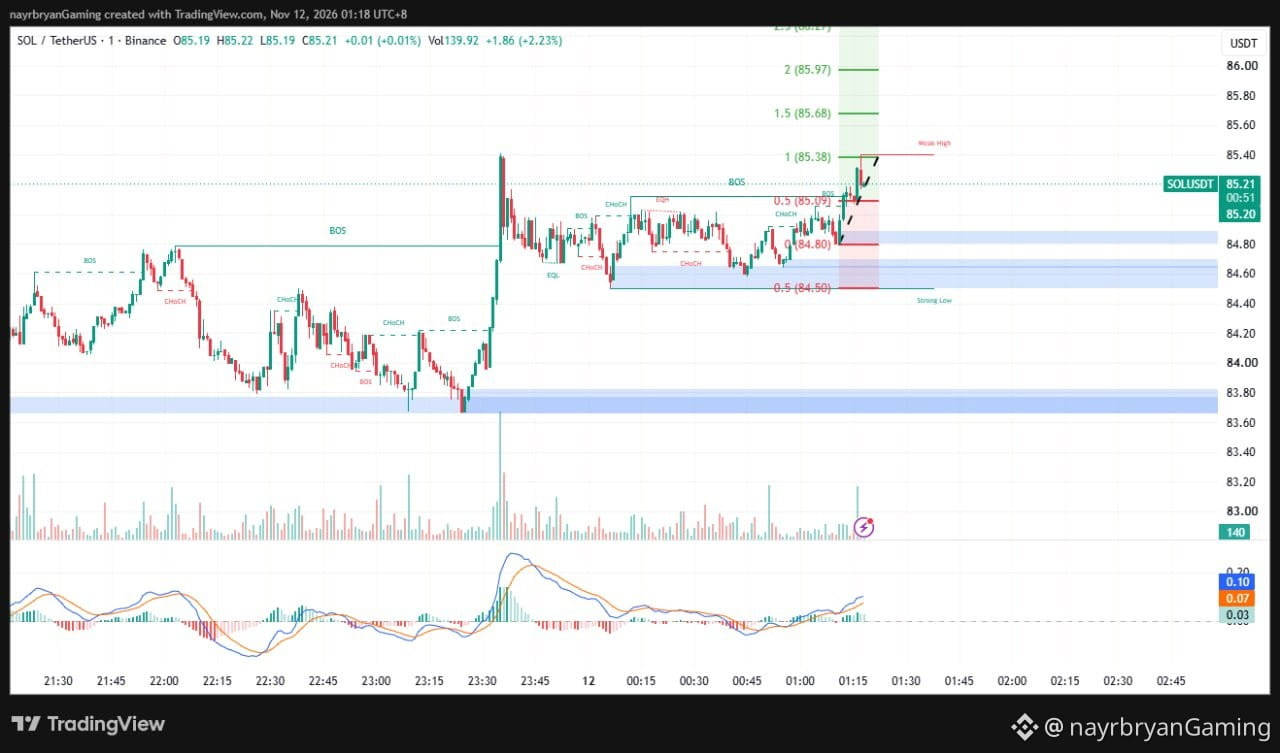
LIGHT ANALYSIS / CHART SETUP — SOL/USDT
📈 STRUCTURE OVERVIEW
Market Phase:
Consolidation → Bullish breakout → Resistance test
Current Price:
85.21
Immediate Resistance:
85.38
Key Fibonacci Levels:
85.09 → 85.38 → 85.68 → 85.97
Immediate Support:
85.09
Short-Term Demand:
84.80–84.85
Major Demand:
84.55–84.65
Strong-Low Reference:
84.50
---
📌 WHAT I'M WATCHING
SCENARIO A — BULLISH CONTINUATION
If SOL maintains its position above 85.09 and buyers successfully break 85.38, price may rotate toward:
85.68 → 85.97.
Watch for breakout confirmation, volume participation, and sustained bullish candles.
SCENARIO B — PULLBACK / SUPPORT TEST
If SOL fails to maintain 85.09, price could revisit:
84.80 → 84.65 → 84.50.
A reaction around these demand areas could determine whether the bullish structure remains intact.
---
📊 INDICATOR CHECK
MACD:
Positive momentum, approximately +0.10 / +0.07, with a positive histogram around +0.03.
Price Structure:
Short-term bullish breakout.
Current Price:
85.21.
Weak-High Resistance:
85.38.
Bullish Confirmation:
Sustained break above 85.38.
Bearish Warning:
Loss of 85.09 followed by failure to reclaim it.
---
📝 CHART NOTE
SOL is approaching an important resistance decision point.
The current structure favors a bullish short-term scenario, but the 85.38 weak high remains an important obstacle.
A breakout should be confirmed rather than anticipated.
This is an educational chart framework, not a trade recommendation.
— @nayrbryanGaming
#SOLAnalysis #ChartSetup #PriceAction #SmartMoney #Fibonacci #CryptoTrading #TechnicalAnalysis #DYOR #NFA
📈 STRUCTURE OVERVIEW
Market Phase:
Consolidation → Bullish breakout → Resistance test
Current Price:
85.21
Immediate Resistance:
85.38
Key Fibonacci Levels:
85.09 → 85.38 → 85.68 → 85.97
Immediate Support:
85.09
Short-Term Demand:
84.80–84.85
Major Demand:
84.55–84.65
Strong-Low Reference:
84.50
---
📌 WHAT I'M WATCHING
SCENARIO A — BULLISH CONTINUATION
If SOL maintains its position above 85.09 and buyers successfully break 85.38, price may rotate toward:
85.68 → 85.97.
Watch for breakout confirmation, volume participation, and sustained bullish candles.
SCENARIO B — PULLBACK / SUPPORT TEST
If SOL fails to maintain 85.09, price could revisit:
84.80 → 84.65 → 84.50.
A reaction around these demand areas could determine whether the bullish structure remains intact.
---
📊 INDICATOR CHECK
MACD:
Positive momentum, approximately +0.10 / +0.07, with a positive histogram around +0.03.
Price Structure:
Short-term bullish breakout.
Current Price:
85.21.
Weak-High Resistance:
85.38.
Bullish Confirmation:
Sustained break above 85.38.
Bearish Warning:
Loss of 85.09 followed by failure to reclaim it.
---
📝 CHART NOTE
SOL is approaching an important resistance decision point.
The current structure favors a bullish short-term scenario, but the 85.38 weak high remains an important obstacle.
A breakout should be confirmed rather than anticipated.
This is an educational chart framework, not a trade recommendation.
— @nayrbryanGaming
#SOLAnalysis #ChartSetup #PriceAction #SmartMoney #Fibonacci #CryptoTrading #TechnicalAnalysis #DYOR #NFA