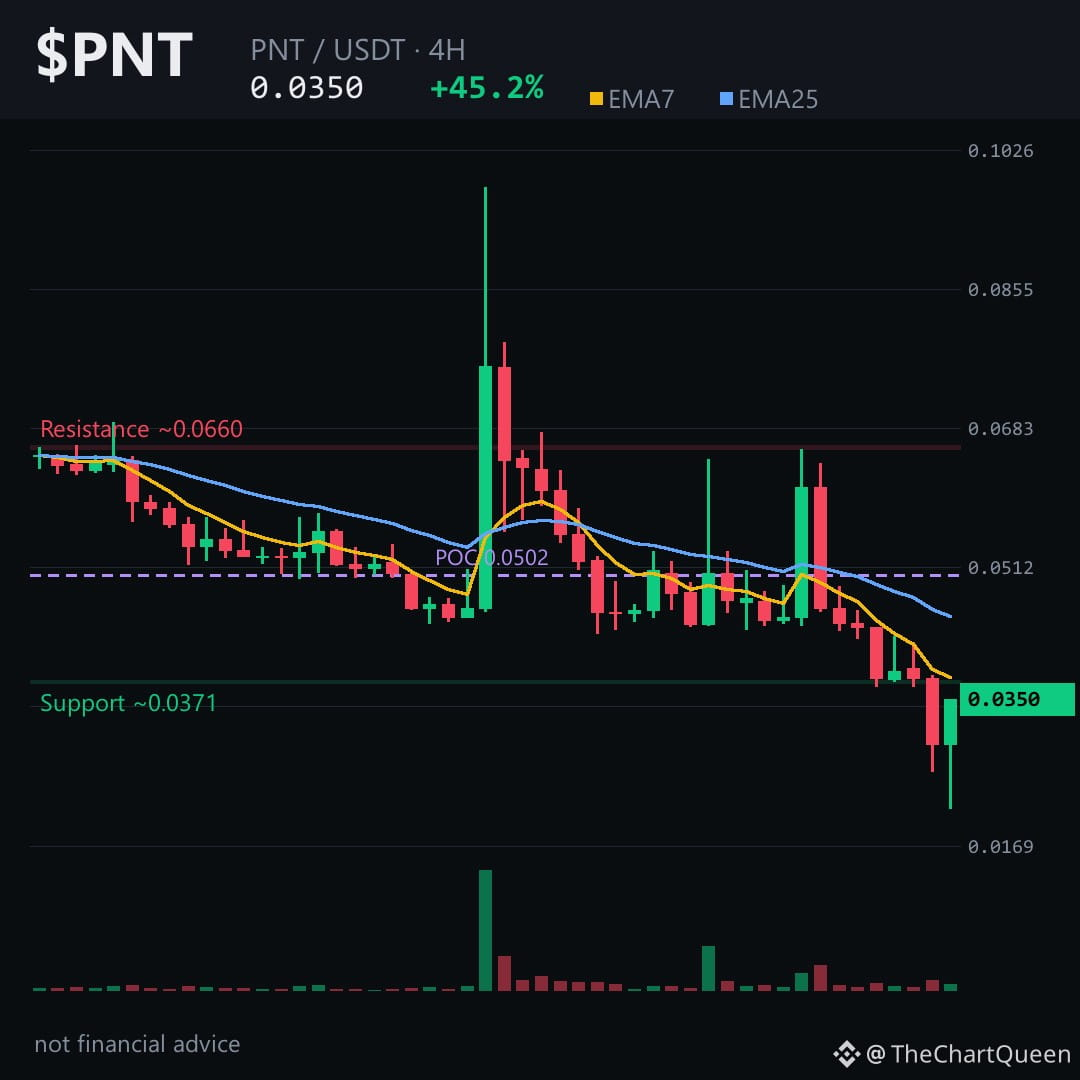
When a 4‑hour candle rockets from 0.045 to 0.061 and then crashes back to 0.035, the market is shouting “reverse”. $PNT is at a crossroads.
Price is clearly in a downtrend, yet the sudden 35% intraday spike left a lingering bullish imprint in the order flow. The EMA gap and a waning RSI around 40 suggest sellers are still in control, but the lingering bullish pressure could trap the next move.
On the 4‑hour chart $PNT is hugging the ~0.035 zone; a break above the ~0.0369 ceiling would flip the bias, while a slide toward the ~0.032 area looks like the next logical stop. Tap $PNT to pull up the chart and see these levels yourself.
I think the most probable path is a test of the low‑0.032 region, with the real danger if price re‑captures the ~0.0369 barrier.
Follow me for the next update when this zone either holds or collapses – you’ll see the next move before the market reacts. What level do you think will be the decisive test for PNT? 👇
⚠️ Not financial advice. DYOR.
#PNT #pNetwork #Crypto #BinanceSquare
Price is clearly in a downtrend, yet the sudden 35% intraday spike left a lingering bullish imprint in the order flow. The EMA gap and a waning RSI around 40 suggest sellers are still in control, but the lingering bullish pressure could trap the next move.
On the 4‑hour chart $PNT is hugging the ~0.035 zone; a break above the ~0.0369 ceiling would flip the bias, while a slide toward the ~0.032 area looks like the next logical stop. Tap $PNT to pull up the chart and see these levels yourself.
I think the most probable path is a test of the low‑0.032 region, with the real danger if price re‑captures the ~0.0369 barrier.
Follow me for the next update when this zone either holds or collapses – you’ll see the next move before the market reacts. What level do you think will be the decisive test for PNT? 👇
⚠️ Not financial advice. DYOR.
#PNT #pNetwork #Crypto #BinanceSquare