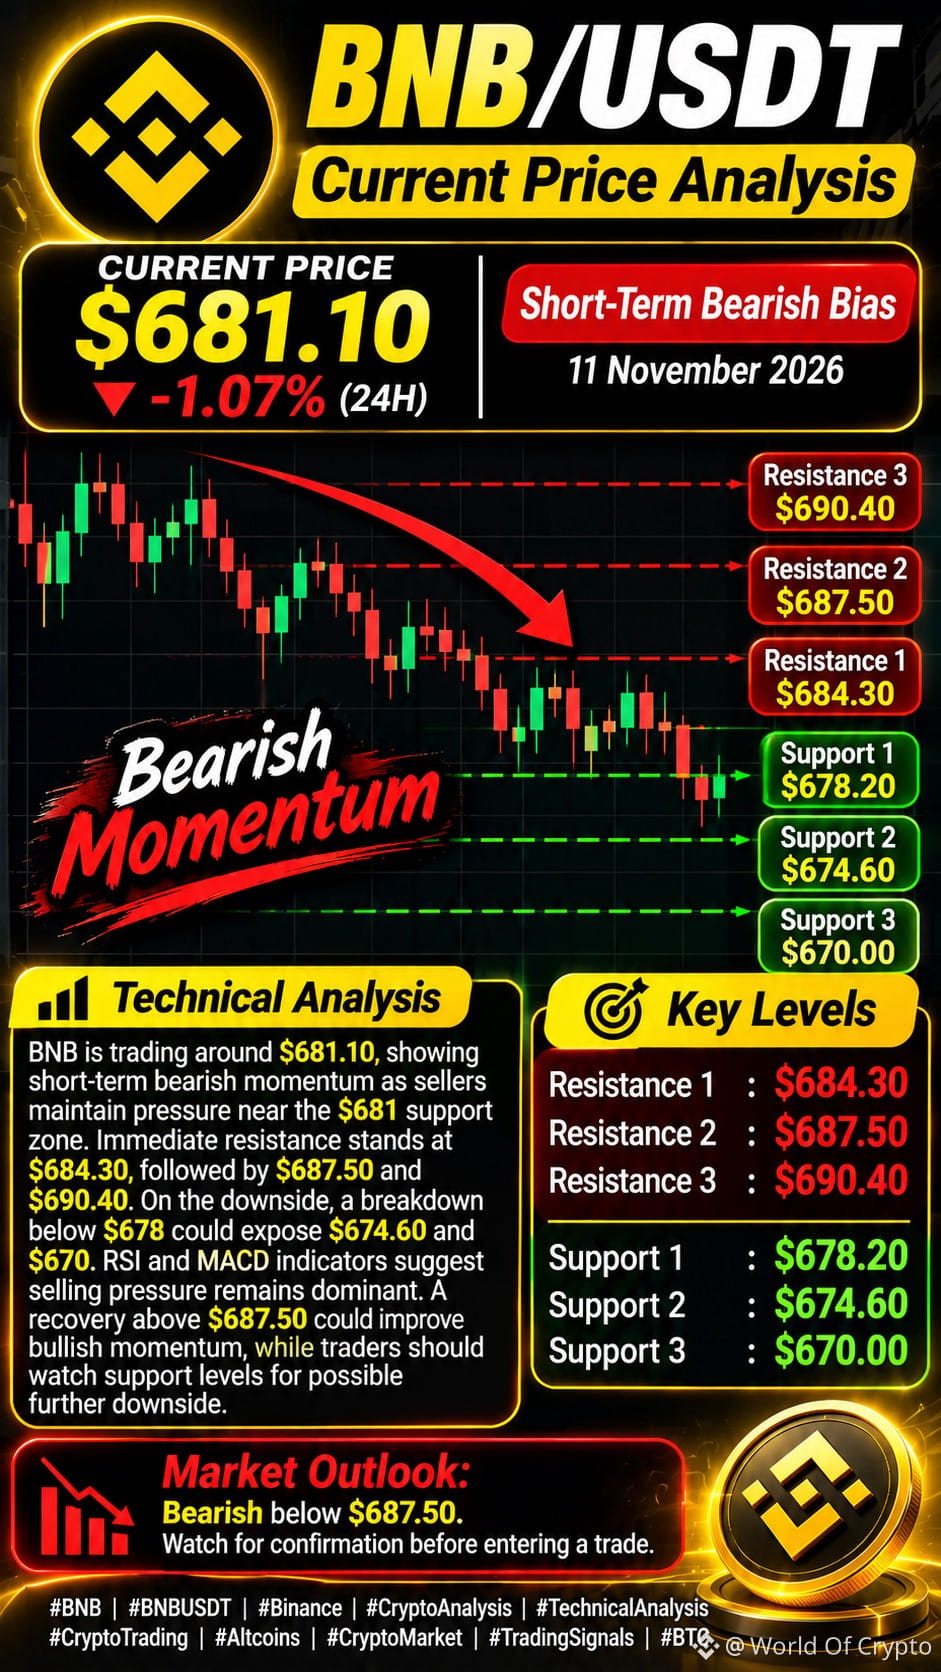
$BNB /USDT — Technical Analysis
BNB is trading around $681.10, showing short-term bearish momentum as sellers maintain pressure near the $681 support zone. Immediate resistance stands at $684.30, followed by $687.50 and $690.40. On the downside, a breakdown below $678 could expose $674.60 and $670. RSI and MACD indicators suggest selling pressure remains dominant. A recovery above $687.50 could improve bullish momentum, while traders should watch support levels for possible further downside.
Market Outlook: Bearish below $687.50. Watch for confirmation before entering a trade.
#HotCPIDecemberHikePriced
BNB is trading around $681.10, showing short-term bearish momentum as sellers maintain pressure near the $681 support zone. Immediate resistance stands at $684.30, followed by $687.50 and $690.40. On the downside, a breakdown below $678 could expose $674.60 and $670. RSI and MACD indicators suggest selling pressure remains dominant. A recovery above $687.50 could improve bullish momentum, while traders should watch support levels for possible further downside.
Market Outlook: Bearish below $687.50. Watch for confirmation before entering a trade.
#HotCPIDecemberHikePriced