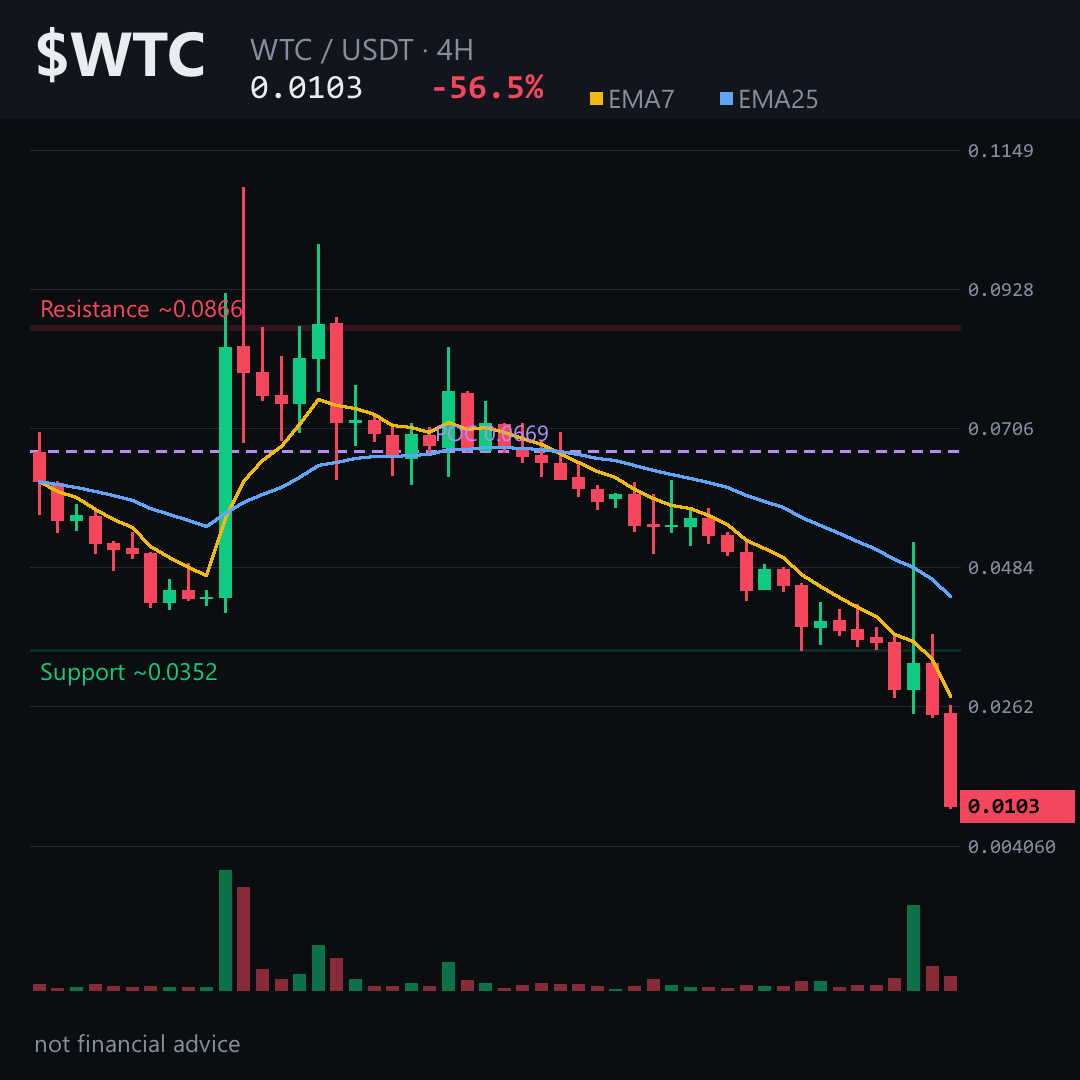
56.5% down in 24 h and the price is now hovering just 0.00005 USDT below the 4‑hour pivot. A hidden bearish pressure is building – keep reading.
🔎 The levels don’t lie 👇
Price is stuck under the 4H EMA cluster (EMA7 ≈ 0.0278 vs EMA25 ≈ 0.0434) and RSI sits at 20 — well into oversold territory, yet the candle flow is 9 red vs 3 green in the last 48 h, confirming short‑term weakness.
On the 4‑hour chart the current area clusters around $0.01035. If $WTC slides through the ~0.01087 zone, the bearish case collapses; otherwise the next likely destination is the ~0.00942 objective zone. Tap $WTC to pull up the chart and see these zones yourself.
My read: the market is testing a short‑term support that’s likely to give way, putting the next move toward the low‑0.0094 area.
Follow me for a fresh breakdown when that support finally cracks or holds – the next swing will reveal whether the downtrend can be arrested.
What level do you think will be the decisive test for $WTC today? 👇
⚠️ Not financial advice. DYOR.
#WTC #Crypto #BinanceSquare #TopLoser
🔎 The levels don’t lie 👇
Price is stuck under the 4H EMA cluster (EMA7 ≈ 0.0278 vs EMA25 ≈ 0.0434) and RSI sits at 20 — well into oversold territory, yet the candle flow is 9 red vs 3 green in the last 48 h, confirming short‑term weakness.
On the 4‑hour chart the current area clusters around $0.01035. If $WTC slides through the ~0.01087 zone, the bearish case collapses; otherwise the next likely destination is the ~0.00942 objective zone. Tap $WTC to pull up the chart and see these zones yourself.
My read: the market is testing a short‑term support that’s likely to give way, putting the next move toward the low‑0.0094 area.
Follow me for a fresh breakdown when that support finally cracks or holds – the next swing will reveal whether the downtrend can be arrested.
What level do you think will be the decisive test for $WTC today? 👇
⚠️ Not financial advice. DYOR.
#WTC #Crypto #BinanceSquare #TopLoser