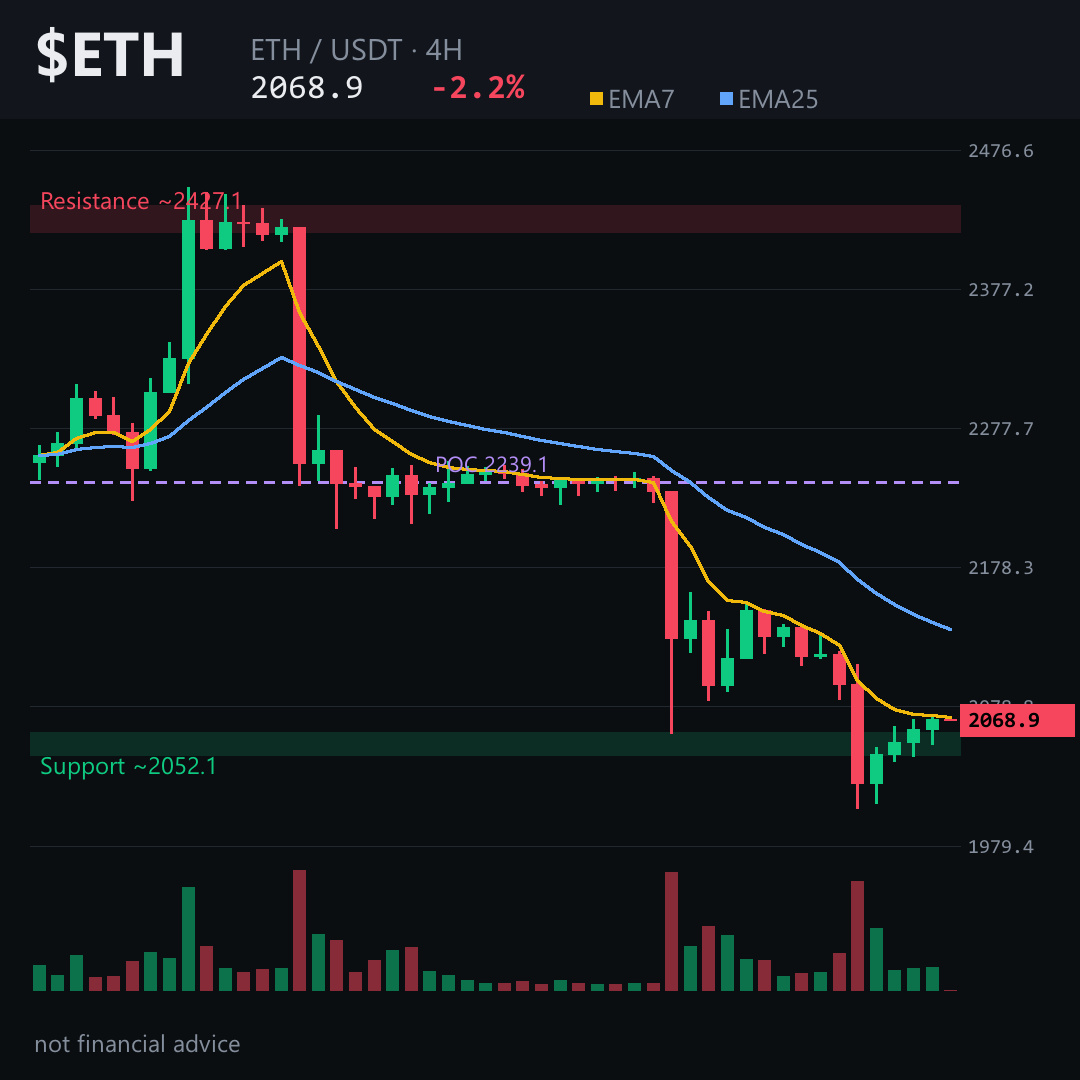
$ETH can’t keep the 2,111‑zone — the next candle may decide if it slides toward the 1,770 area. 👀
Price is hovering just below the daily pivot while the EMA7 sits far under EMA25, a classic bearish spread. Funding is positive (0.0047 %), meaning longs are paying to stay, and a 3.28 × long‑short ratio shows the crowd is heavily long‑biased – a contrarian warning sign.
On the 1‑day chart the key zones line up: the swing pivot sits around the 2,111 zone, the invalidation ceiling is near 2,280, and the downside target clusters around 1,770. If $ETH loses the 2,111 area on a daily close, the path to 1,770 becomes more likely. Tap $ETH to pull up the chart and see these levels yourself.
My read: the daily picture leans bearish; the real risk is a break above 2,280, which would invalidate this downside thesis.
Follow for the next swing‑break analysis when ETH tests the 2,280 ceiling – you’ll get the full picture before the move unfolds.
Which zone are you watching most closely on ETH? 👇
⚠️ Not financial advice. DYOR.
#ETH #Ethereum #Crypto #BinanceSquare
Price is hovering just below the daily pivot while the EMA7 sits far under EMA25, a classic bearish spread. Funding is positive (0.0047 %), meaning longs are paying to stay, and a 3.28 × long‑short ratio shows the crowd is heavily long‑biased – a contrarian warning sign.
On the 1‑day chart the key zones line up: the swing pivot sits around the 2,111 zone, the invalidation ceiling is near 2,280, and the downside target clusters around 1,770. If $ETH loses the 2,111 area on a daily close, the path to 1,770 becomes more likely. Tap $ETH to pull up the chart and see these levels yourself.
My read: the daily picture leans bearish; the real risk is a break above 2,280, which would invalidate this downside thesis.
Follow for the next swing‑break analysis when ETH tests the 2,280 ceiling – you’ll get the full picture before the move unfolds.
Which zone are you watching most closely on ETH? 👇
⚠️ Not financial advice. DYOR.
#ETH #Ethereum #Crypto #BinanceSquare