
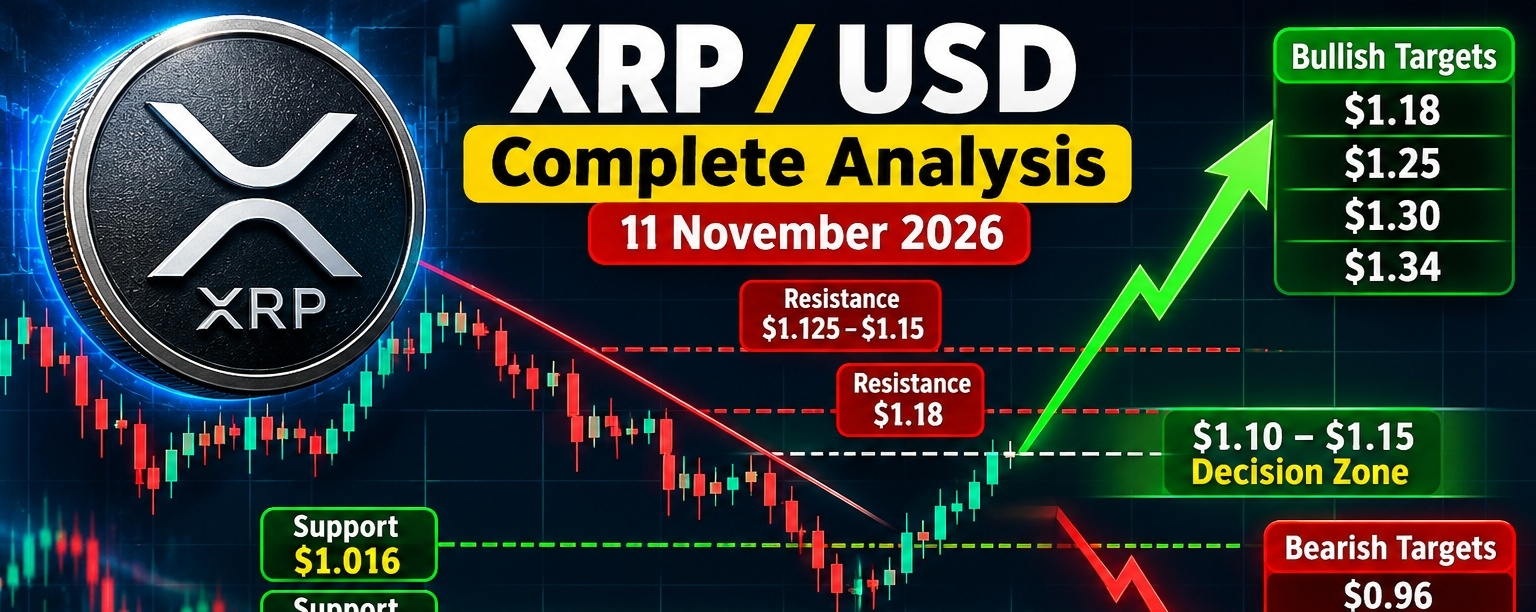

$XRP /USD Complete Analysis — 11 November 2026
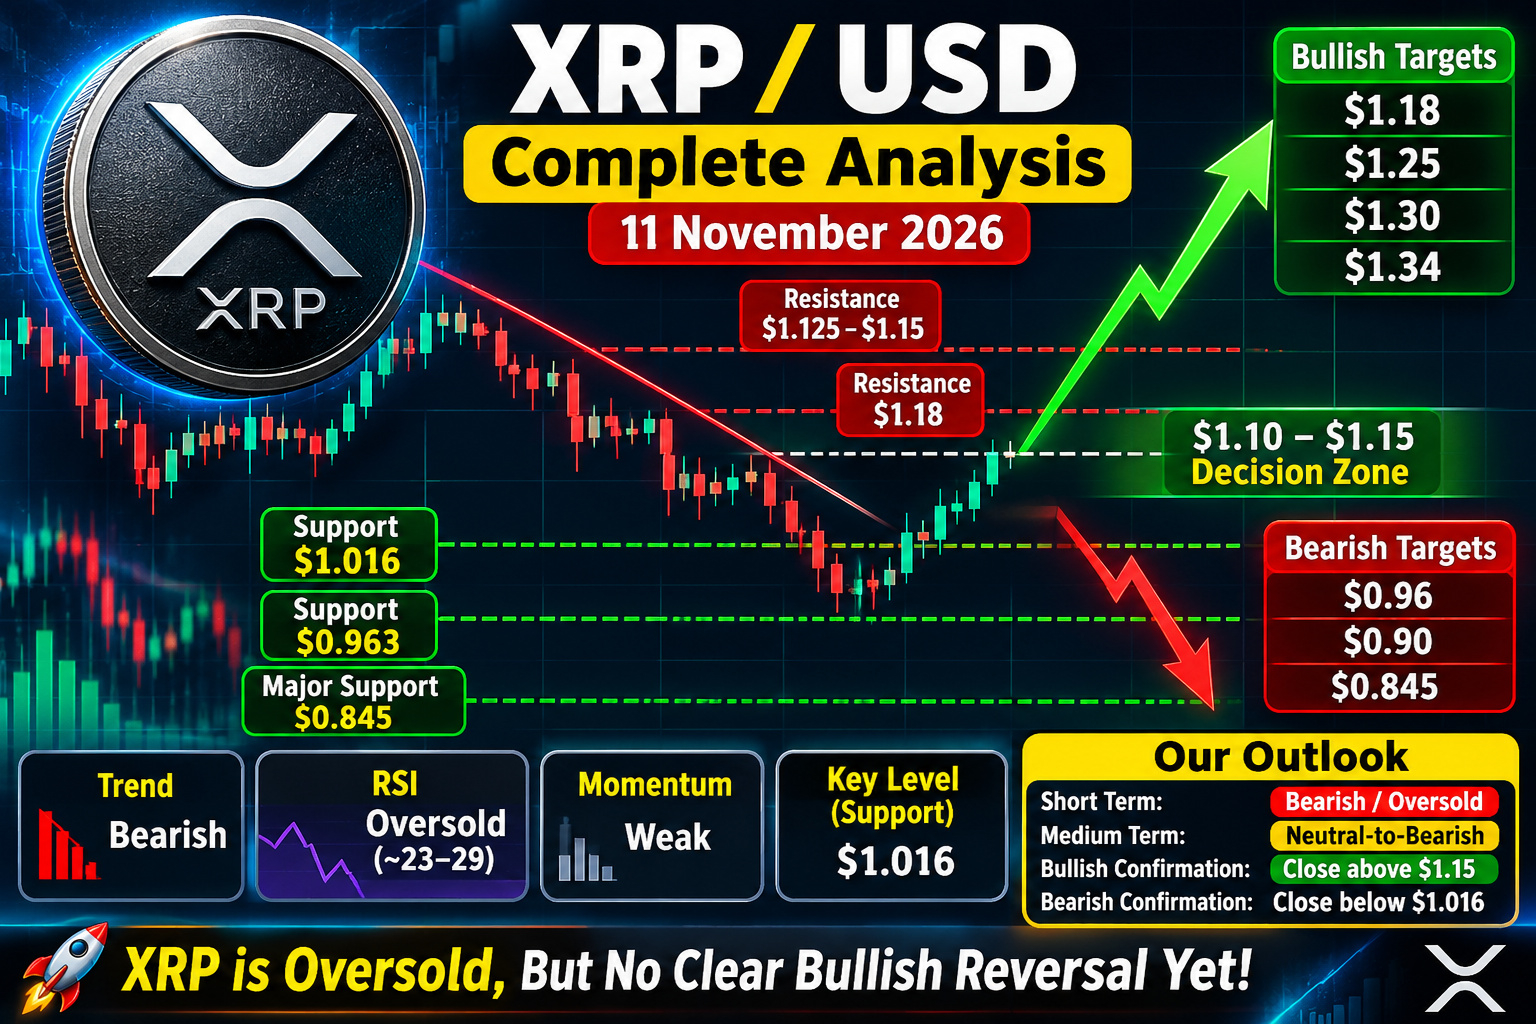
Current market structure: $XRP is in a strong short-term bearish trend, trading around the $1.04–$1.10 area after a sharp decline. Recent technical readings show RSI in oversold territory, which creates potential for a relief bounce, but the trend has not yet turned bullish.
📊 Key Levels
Level Price Importance
🔴 Major resistance $1.125–$1.15 Breakout zone
🔴 Resistance $1.18 Stronger upside barrier
🟡 Pivot area $1.10 Short-term trend line
🟢 Support $1.016 Key immediate support
🟢 Support $0.963 Major downside support
🟢 Major support $0.845 Stronger bearish target
Technical sources currently place first resistance around $1.12–$1.13 and support around $1.02–$1.07, with RSI deeply oversold.
📉 Technical Picture
Trend: 🔴 Bearish
RSI: ~23–29 → Oversold
Momentum: Weak
4H trend: Bearish
Daily trend: Bearish
Weekly trend: Bearish
$XRP is below its major moving averages, and the 50-day average remains below/around the longer-term trend structure, keeping the broader technical setup weak.
However, the oversold RSI means a short-term bounce is possible before another move lower. A bounce by itself should not be considered a confirmed trend reversal.
🚀 Bullish Scenario
For bulls, the first important test is $1.10–$1.13.
If XRP can achieve a daily close above $1.125–$1.15 with strong volume, the next targets could be:
- $1.18
- $1.25
- $1.30
- $1.34
A sustained move above approximately $1.25–$1.30 would significantly improve the medium-term structure. One November projection also identifies roughly $1.20–$1.33 as an important range.
🔻 Bearish Scenario
The most important level now is approximately $1.02.
If XRP loses $1.016 on a daily closing basis, downside risk increases toward:
$0.96 → $0.90 → $0.845
A break below $0.96 would indicate that the current correction is becoming considerably deeper.
🐋 Fundamental/Market Factors
Institutional interest has been a positive factor for XRP. Reports have highlighted substantial cumulative spot-ETF inflows, although those inflows have not yet translated into a decisive price breakout.
The regulatory backdrop around Ripple/XRP has also improved compared with the earlier years of the SEC dispute, but price remains heavily influenced by the broader crypto market and liquidity conditions.
🎯 My XRP/USD Outlook
Short term: 🔴 Bearish / Oversold
Medium term: 🟡 Neutral-to-bearish until $1.15–$1.25 is reclaimed
Bullish confirmation: Daily close above $1.15, followed by a break of $1.18–$1.25
Bearish confirmation: Daily close below $1.016
Possible trading map
- Above $1.15: bullish momentum can develop
- $1.10–$1.15: major decision zone
- $1.02–$1.10: high-risk consolidation/accumulation zone
- Below $1.02: bearish continuation
- Below $0.96: risk of a move toward $0.85
Overall rating: 4/10 bullish — 6/10 bearish.
The key point is that XRP is oversold, so chasing shorts at the current low can be risky; but there is not yet enough evidence for a confirmed bullish reversal. Wait for price/volume confirmation around $1.10–$1.15 rather than relying on RSI alone.
This is market analysis, not financial advice. Crypto can move sharply in either direction.