$AMDB : Equilibrium and the Volume Anchor
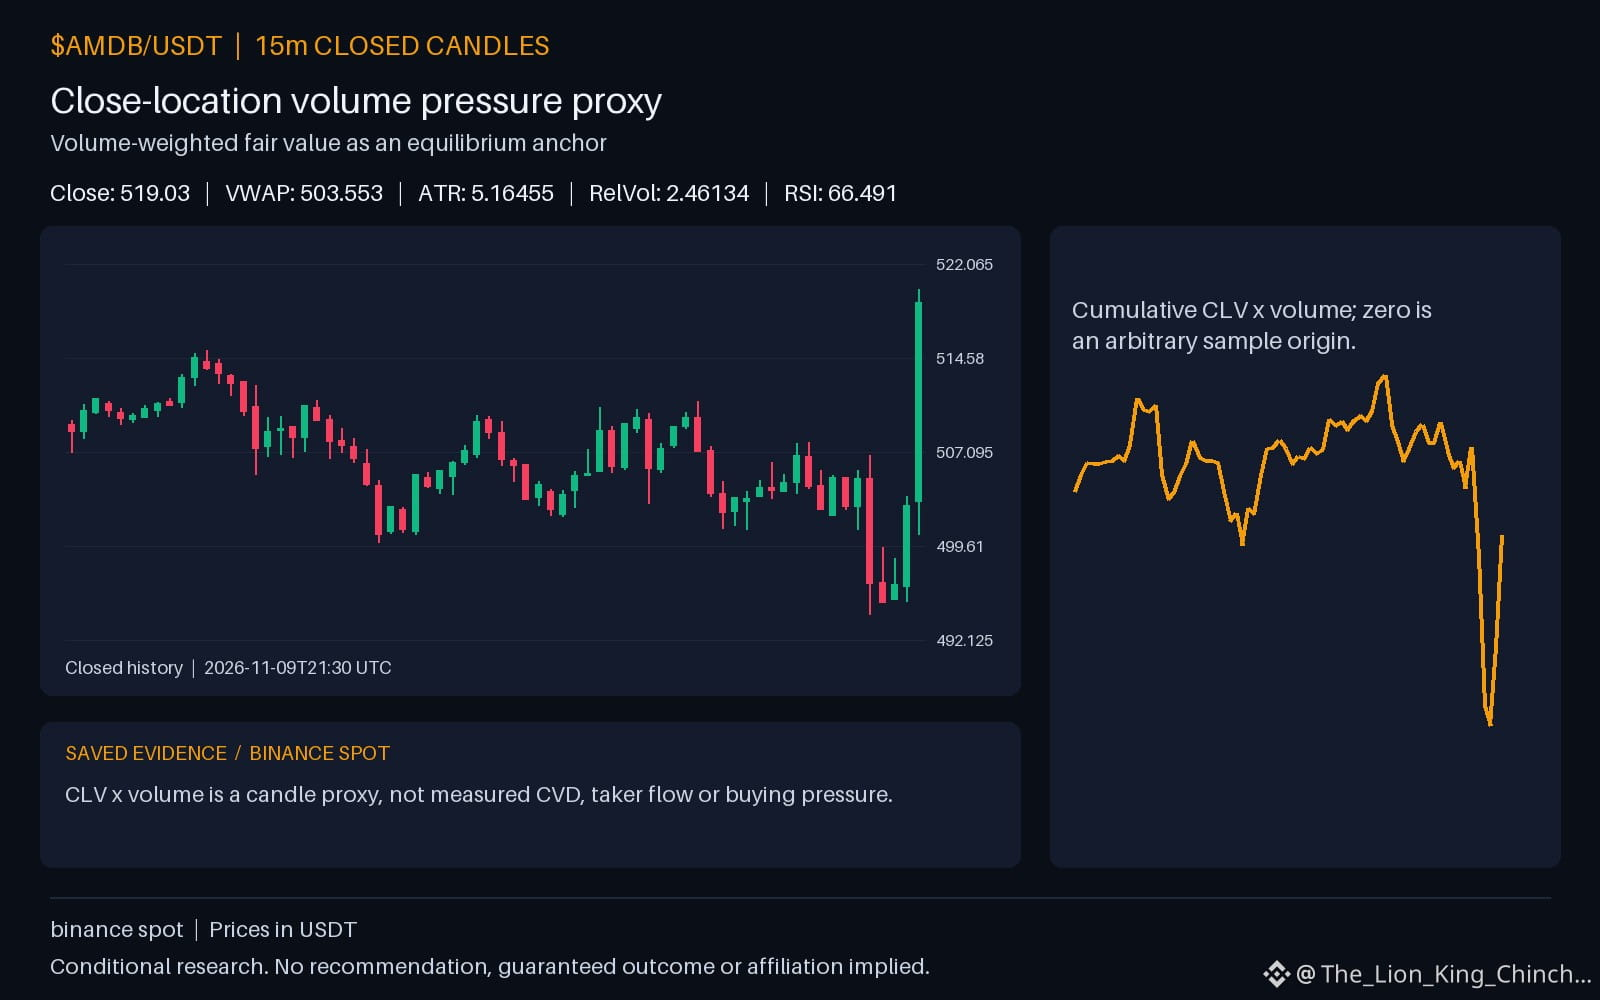
Does a price move away from the daily volume average represent a structural shift or a temporary stretch? This question arises as $AMDB currently sits at 519.03 while the daily volume-weighted average price rests at 503.553. We can explore this using the concept of volume-weighted fair value as a hypothetical equilibrium anchor.
One clue suggests that when hourly volume like 2.46134 remains high, price might be establishing a new accepted value zone. In this scenario, the anchor moves to meet the price. An alternative reading is that the distance between 519.03 and 503.553 creates a mechanical tension. If price cannot sustain its position above resistance at 511.09, the anchor might pull the price back toward the mean to find buyers.
This interpretation weakens if volatility, measured by 5.16455, expands so rapidly that the anchor becomes irrelevant. A self-check involves observing the RSI at 66.491. If momentum fades while the gap between the current price and 503.553 remains wide, the hypothesis of a return to equilibrium gains weight. Conversely, if $AMDB consolidates near 511.09 while 503.553 rises to meet it, the anchor has reset. ⚖️
Probabilistic market research, not a recommendation or guaranteed return.
How do you tell when price has enough momentum to break free from daily VWAP versus when it is just stretching before snapping back?
#AMDB #MarketAnalysis #CryptoLearning
Binance spot proof for $AMDB : closed price 519.03 USDT.
Source: binance. Closed candle: 2026-11-10T14:45:00+00:00.
Does a price move away from the daily volume average represent a structural shift or a temporary stretch? This question arises as $AMDB currently sits at 519.03 while the daily volume-weighted average price rests at 503.553. We can explore this using the concept of volume-weighted fair value as a hypothetical equilibrium anchor.
One clue suggests that when hourly volume like 2.46134 remains high, price might be establishing a new accepted value zone. In this scenario, the anchor moves to meet the price. An alternative reading is that the distance between 519.03 and 503.553 creates a mechanical tension. If price cannot sustain its position above resistance at 511.09, the anchor might pull the price back toward the mean to find buyers.
This interpretation weakens if volatility, measured by 5.16455, expands so rapidly that the anchor becomes irrelevant. A self-check involves observing the RSI at 66.491. If momentum fades while the gap between the current price and 503.553 remains wide, the hypothesis of a return to equilibrium gains weight. Conversely, if $AMDB consolidates near 511.09 while 503.553 rises to meet it, the anchor has reset. ⚖️
Probabilistic market research, not a recommendation or guaranteed return.
How do you tell when price has enough momentum to break free from daily VWAP versus when it is just stretching before snapping back?
#AMDB #MarketAnalysis #CryptoLearning
Binance spot proof for $AMDB : closed price 519.03 USDT.
Source: binance. Closed candle: 2026-11-10T14:45:00+00:00.