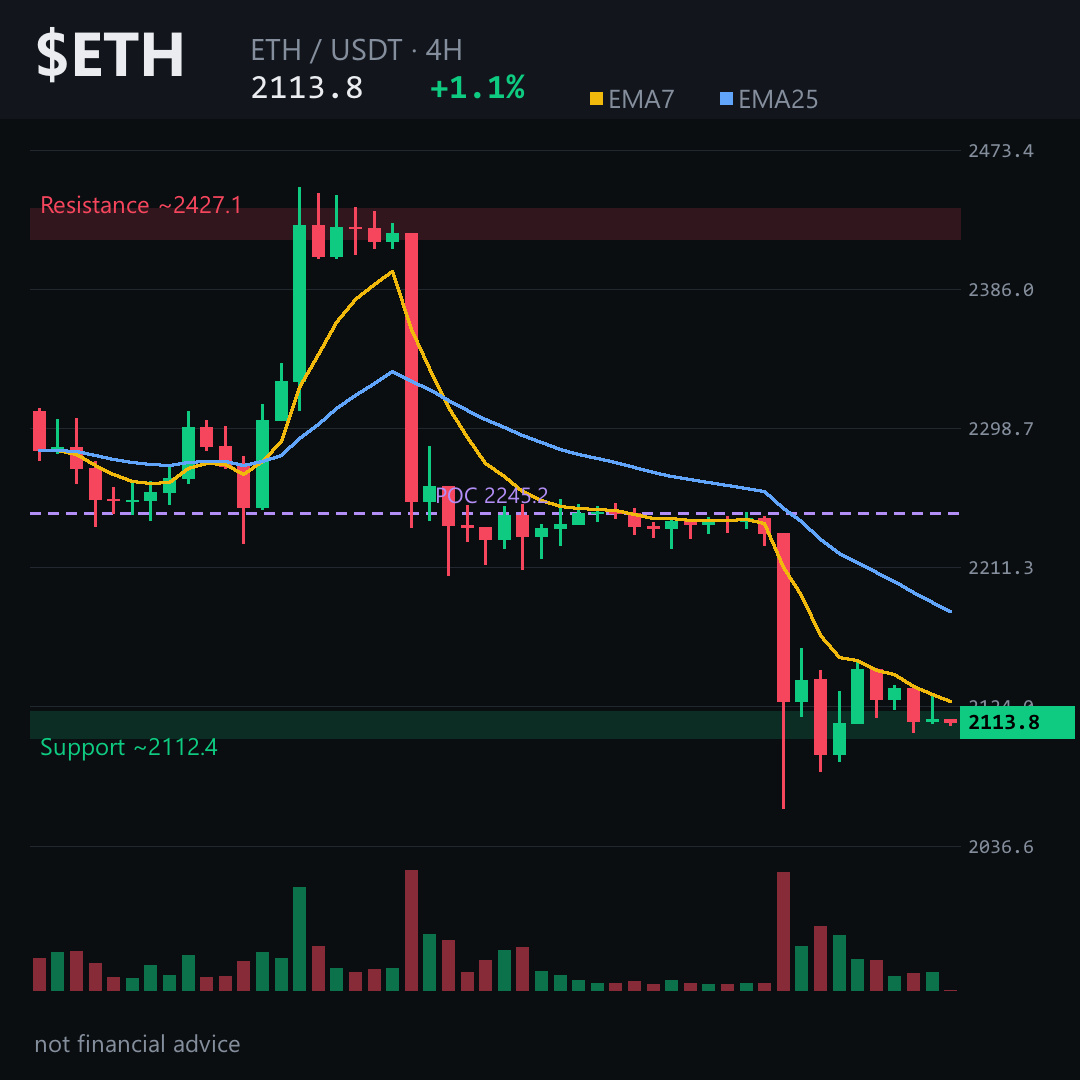
A 4.7% candle in one 4-hour window. That's not noise — that's a structure break.
$ETH slid under both key moving averages with weak momentum. The long/short ratio sits near 3.9 — leveraged longs are crowded, yet funding is barely positive. The crowd is leaning one way, but the fee structure isn't paying them to be there.
Price has been grinding lower since 2225 failed — that zone now acts as an unfilled bearish gap down to roughly 2160. Below that, 2127 is the current pivot. Lose it on a 4H close, and the path toward 2010 opens up. That's geometry, not a prediction. The invalidation sits around 2192. Reclaim that, and this bearish structure starts to crack.
Daily: 2160 is the line in the sand — lose it, and the objective stretches toward 1815. Weekly still leans bullish long-term, so I'm treating this as a 4H-to-daily correction, not a macro breakdown.
Short-term structure favors continued downside while price stays below 2190, but crowded longs make any bounce sharp and fast.
Tap $ETH to pull up the chart and check these zones yourself.
Which level are you watching more closely — the 2127 pivot or the 2160 daily floor? Drop your read on $ETH 👇
Not financial advice. DYOR.
Follow for the next read on this chart.
#ETH #Ethereum #Crypto #BinanceSquare
$ETH slid under both key moving averages with weak momentum. The long/short ratio sits near 3.9 — leveraged longs are crowded, yet funding is barely positive. The crowd is leaning one way, but the fee structure isn't paying them to be there.
Price has been grinding lower since 2225 failed — that zone now acts as an unfilled bearish gap down to roughly 2160. Below that, 2127 is the current pivot. Lose it on a 4H close, and the path toward 2010 opens up. That's geometry, not a prediction. The invalidation sits around 2192. Reclaim that, and this bearish structure starts to crack.
Daily: 2160 is the line in the sand — lose it, and the objective stretches toward 1815. Weekly still leans bullish long-term, so I'm treating this as a 4H-to-daily correction, not a macro breakdown.
Short-term structure favors continued downside while price stays below 2190, but crowded longs make any bounce sharp and fast.
Tap $ETH to pull up the chart and check these zones yourself.
Which level are you watching more closely — the 2127 pivot or the 2160 daily floor? Drop your read on $ETH 👇
Not financial advice. DYOR.
Follow for the next read on this chart.
#ETH #Ethereum #Crypto #BinanceSquare