
━━━━━━━━━━━━━━━━━━━━
MARKET OVERVIEW
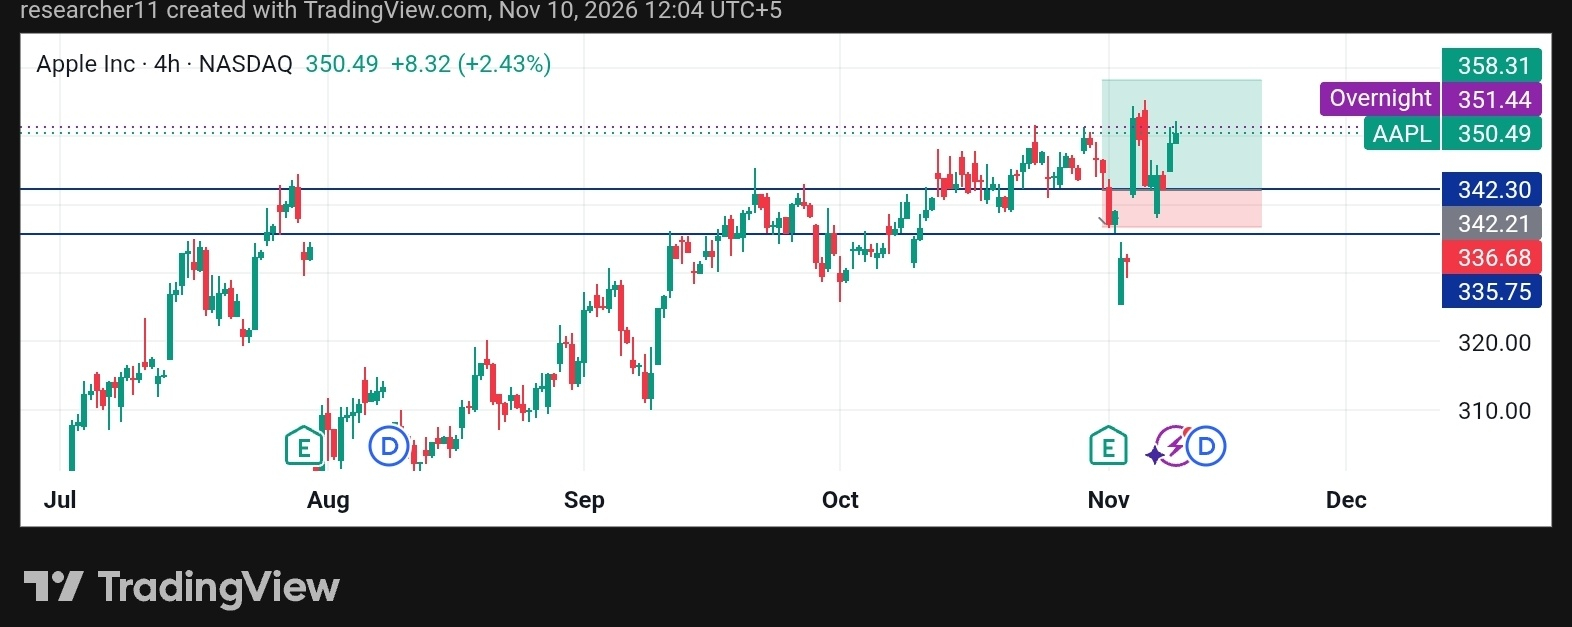
Apple (AAPL) is trading near $350.49 on the 4H chart, up about 2.43% on the day. After a sharp dip in early November, price recovered quickly, which shows strong dip-buying interest. Momentum is leaning bullish.
━━━━━━━━━━━━━━━━━━━━
TECHNICAL ANALYSIS
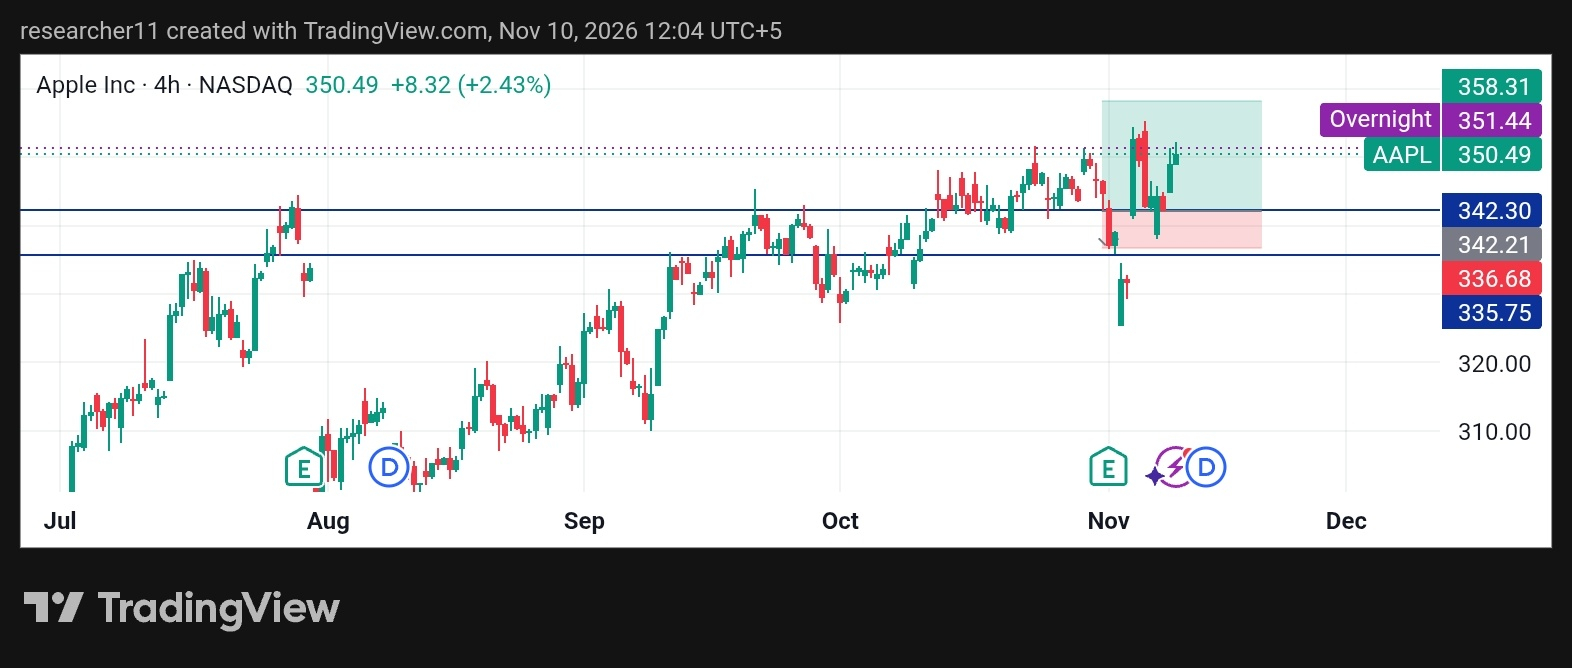
The $342 zone has acted as a key pivot. Price dipped below it, then reclaimed it fast. The sudden wick down and recovery looks like a liquidity sweep, where weak hands get shaken out before price moves back up.
Price is now holding above $342 and printing higher lows. The overnight price near $351.44 shows buyers staying active. The broader structure since July remains an uptrend with consistent higher highs.
━━━━━━━━━━━━━━━━━━━━
SCENARIOS
🟢 Bullish Case: Holding above $342 and breaking cleanly above $351.44 opens the path toward $358.31.
🔴 Bearish Case: A 4H close back below $342 would weaken the recovery. A move under $336 would suggest the bounce failed.
⚪ Neutral Case: Price consolidates between $342 and $351 while momentum cools.
━━━━━━━━━━━━━━━━━━━━
KEY LEVELS
🔺 Resistance: R1: $351.44 | R2: $358.31
🔻 Support: S1: $342.30 | S2: $335.75
━━━━━━━━━━━━━━━━━━━━
CONCLUSION
AAPL has shown resilience after a sharp shakeout. The $342 zone is the level to watch. As long as it holds, the bullish structure stays intact.
⚠️ This is market analysis for informational purposes only, not financial advice.
#AAPL #CPITestsDecemberRateOutlook #NvidiaInvestigatesAfterHuang’sAffairApology $AAPL